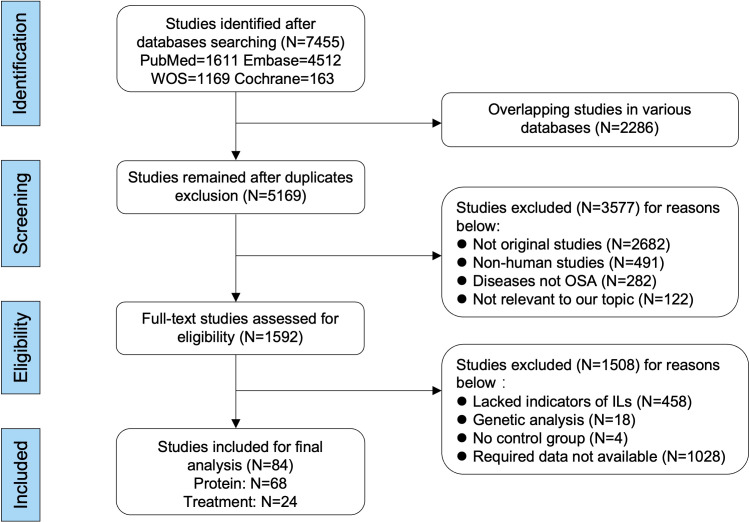
Figure 1.
Flow diagram of literature selecting based on the inclusive and exclusive criteria. Among the included 84 publications, 68 studies were used for comparing the differences of interleukin levels between OSA and healthy control, and 24 studies were used for analyzing the changed levels of interleukins in patients with OSA responding to treatments. The format and unit of measurements were mean ± standard deviation and picograms per milliliter, respectively.

