
Figure 2.
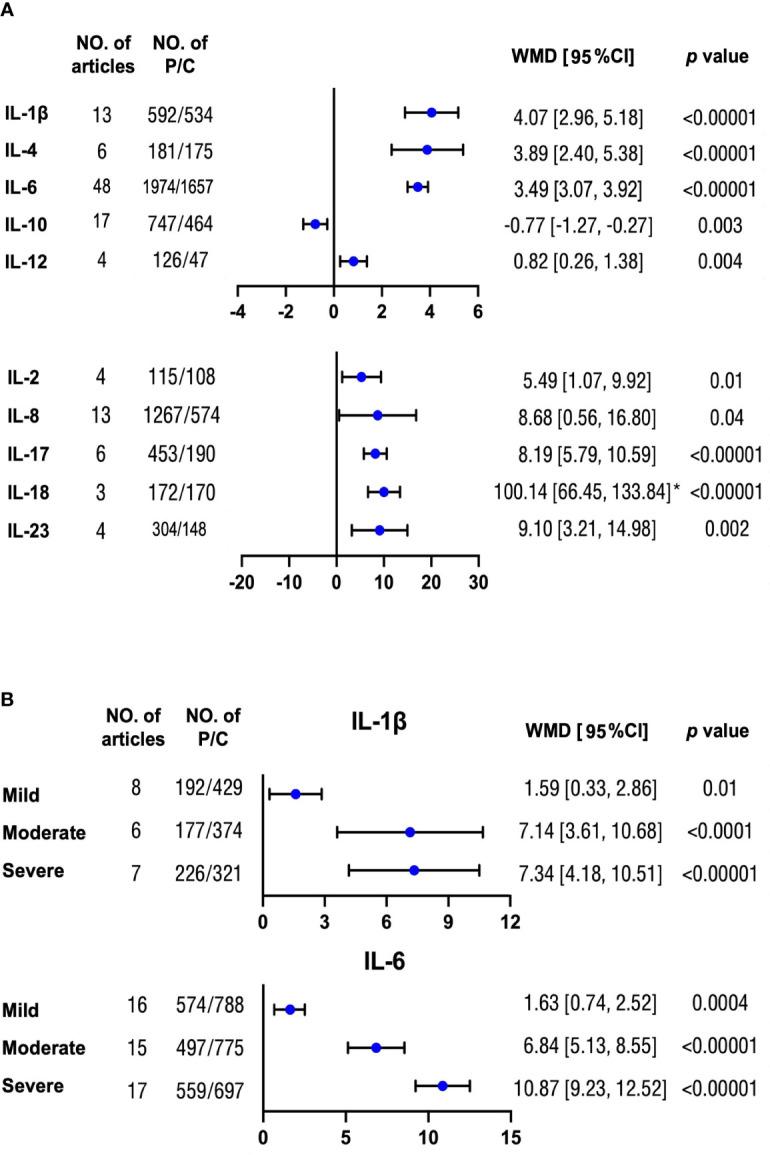
Mean differences of multiple interleukin levels between OSA and non-OSA subjects. (A) Concentration differences for several interleukin proteins were compared between patients with OSA and non-OSA controls. (B) Protein levels of IL-1β and IL-6 were analyzed between patients with OSA with mild, moderate, and severe severity and controls, respectively. The unit for all protein concentrations was presented as picograms per milliliter. Weighted mean difference (WMD) and 95% confidence interval (95% CI) were used for analysis. No. of articles, number of articles included for analysis in each group. No. of P/C, number of patients with OSA (P) and controls (C) were included for each group. *: The original protein value is 10 times higher than that shown in scale. The statistically different results with p < 0.05 were shown in blue point otherwise were in black point if p > 0.05. IL: interleukin.