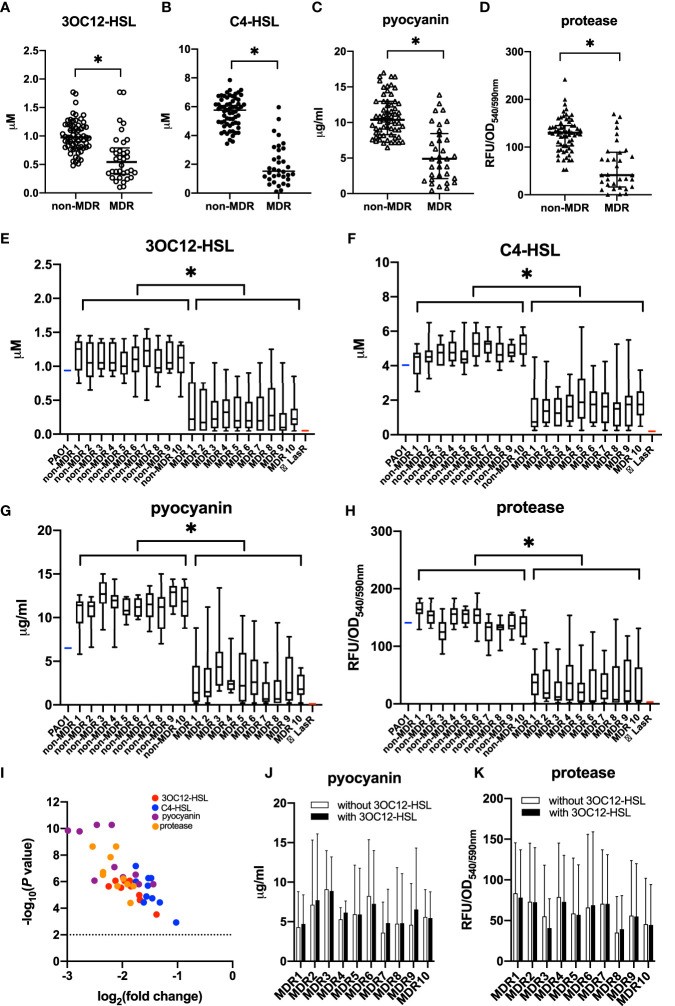
Figure 1.
Quorum sensing (QS) phenotypic assessments for P. aeruginosa isolates from non-cystic fibrosis bronchiectasis patients. P. aeruginosa isolates were classified into the non-MDR group (n = 63) and the MDR group (n = 34) according to their antimicrobial susceptibility test results. The production of QS signals (A, B) and QS-controlled virulence factors (C, D) was compared between MDR isolates and non-MDR isolates from different patients. The data were presented as median with an interquartile range. Another 10 strains were isolated within the sample from each of the 20 randomly chosen patients. Among these patients, 10 had MDR isolates, and the others had non-MDR isolates. The production of QS signals (E, F) and QS-controlled virulence factors (G, H) of MDR isolates or non-MDR isolates within a given patient is shown. PAO1 (blue) and LasR-null mutant (red) served as positive and negative controls, respectively. The whiskers of the boxplot mark the 5th and 95th percentiles, while the box contains the 25th percentile, median, and 75th percentiles. A volcano plot (I) was worked out to show the difference of these QS products between non-MDR isolates and MDR isolates. The dotted line presented the significant level of p = 0.01. The production of pyocyanin (J) and protease (K) was compared between MDR cultures with and without 3OC12-HSL from a given patient. The data are presented as mean ± SD. * p < 0.05. MDR, multidrug resistance; OD, optical density; RFU, relative fluorescence unit.

