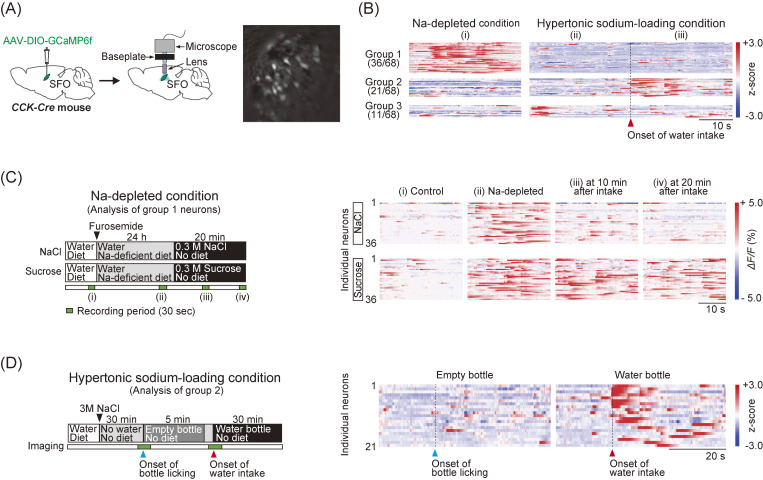
Figure 9.
A: Protocol for the Ca2+ imaging of CCK neurons at the single-cell level in the SFO (left). Representative fluorescence microscopic image of CCK neurons (right). B: Raster plots of three distinct populations of CCK neurons with different activation profiles. C: Protocol for the Ca2+ imaging of group 1 CCK neurons (left). Raster plots of Ca2+ responses by NaCl intake in individual group 1 CCK neurons in Na-depleted conditions (right). D: Protocol for the Ca2+ imaging of group 2 CCK-positive neurons during drinking behaviors (left). Raster plots of individual CCK-positive neurons at temporal positions in (A, right). Figure reference: Ref. 138.

