Figure 10.
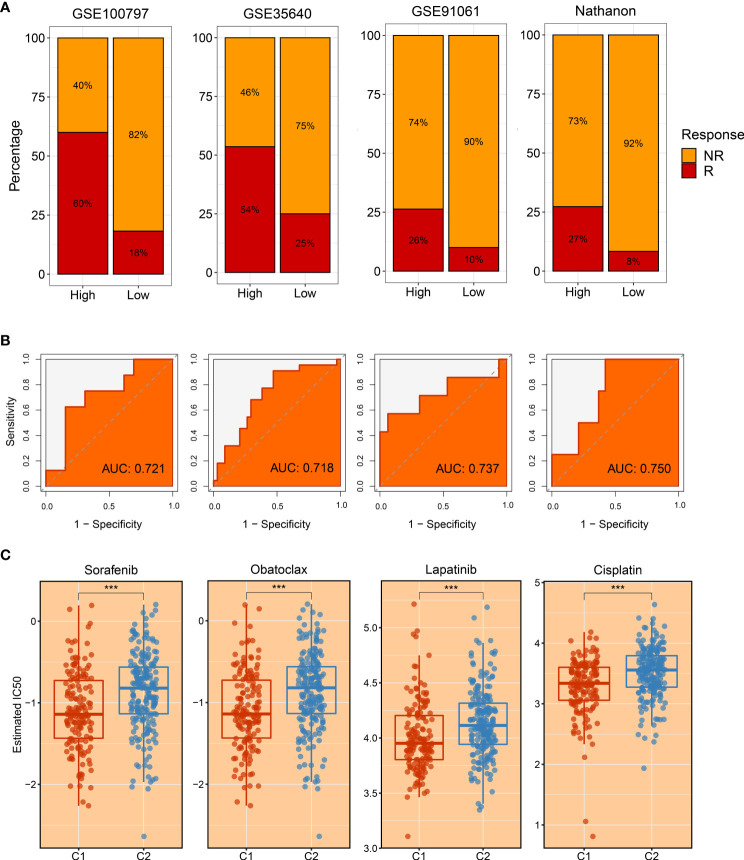
The evaluation of immunotherapy and drug-associated treatment. (A) The immunotherapy response ratio of risk scores measured by characteristic genes in GSE100797, GSE35640, GSE91061, and Nathnaon datasets. (B) Receiver operating characteristic (ROC) curves of risk scores to predict the benefits of immunotherapy in GSE100797, GSE35640, GSE91061, and Nathnaon datasets. (C) The promising therapeutic agents for patients in C1. ***p < 0.001.

