Figure 3.
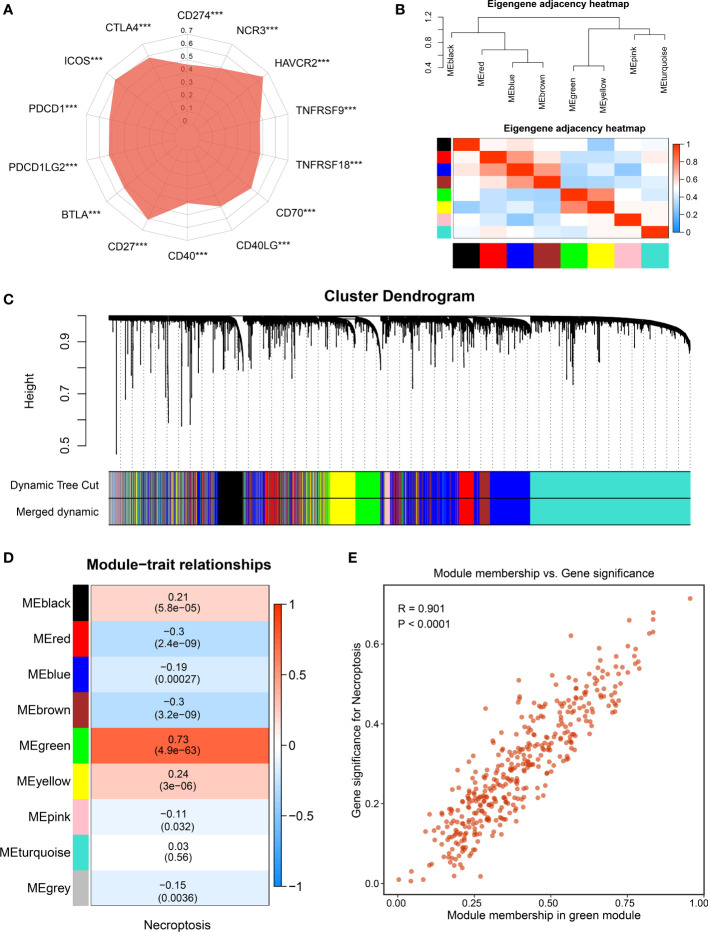
The identification of necroptosis-associated lncRNAs. (A) Correlations between the expression of immune checkpoint molecules and necroptosis score. (B) The heatmap reveals the eigengene adjacency of distinct modules. (C) Clustering dendrograms of co-expression network modules; each module was assigned a color. (D) Correlation analysis between gene modules and necroptosis score. (E) The scatterplot of module membership (MM) vs gene significance (GS) of the necroptosis score. ***p < 0.001.

