Figure 5.
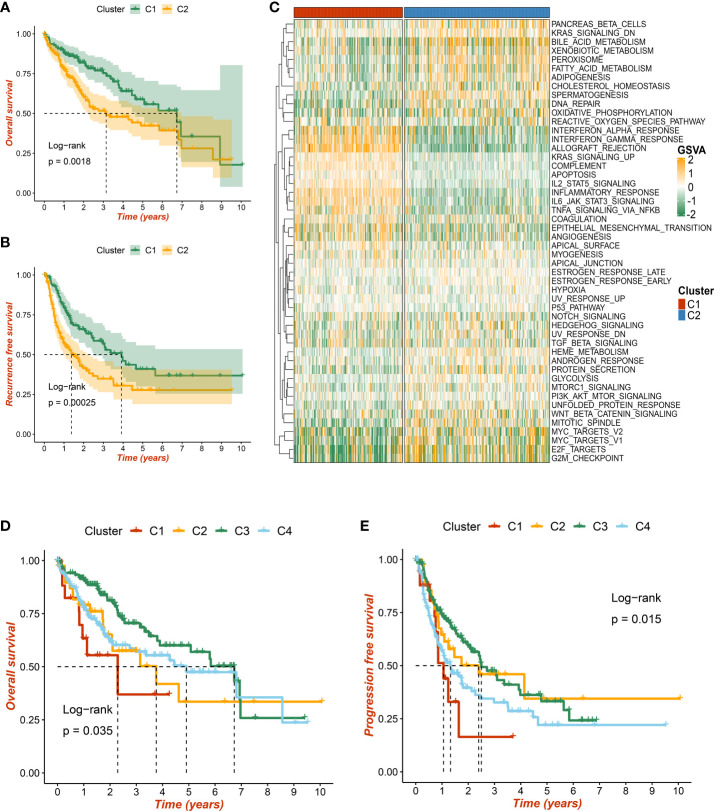
The prognostic significance of necroptosis subtypes. (A) Kaplan–Meier curves of overall survival (OS) according to the necroptosis subtypes in TCGA-LIHC dataset. (B) Kaplan–Meier curves of recurrence-free survival (RFS) according to the necroptosis subtypes in TCGA-LIHC dataset. (C) Heatmap of 50 Hallmark gene sets among three clusters using the gene set variation analysis (GSVA) algorithm. (D, E) Based on previous immune subtypes, Kaplan–Meier curves of OS and progression-free survival (PFS) according to different subtypes, respectively.

