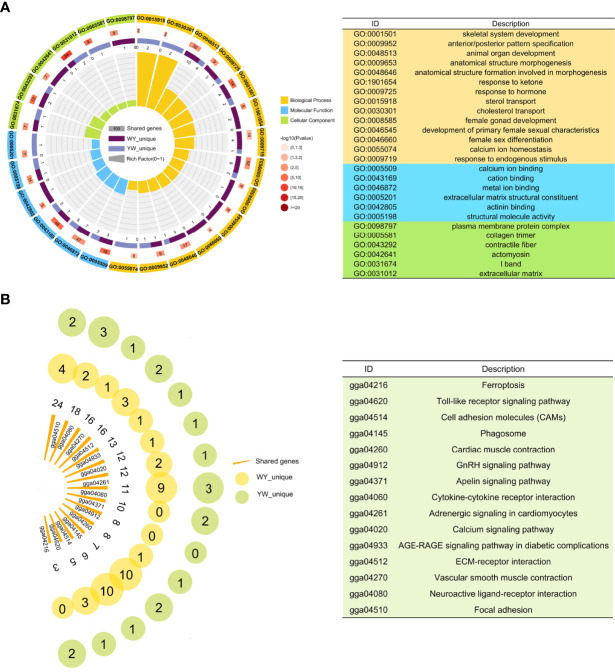
Figure 4.
Function enrichment analysis of nonadditive genes. (A) Significant GO terms of nonadditive genes in crossbreeds. From outer to inner, the outermost circle represents the IDs of enriched GO terms. The names of GO ID in orange, blue and green represent biological process, molecular function and cell composition respectively. The second circle indicates shared genes enriched in GO terms. In the third circle, the piece in dark purple and light purple represents unique genes of WY and YW, respectively. In the innermost circle, each bar represents one GO term, and the size represents the rich factor. (B) KEGG pathway analysis for nonadditive genes. Each bar represents one pathway and the size represents the number of shared genes. The yellow and green circle represents the unique genes in WY and YW of each pathway, respectively.

