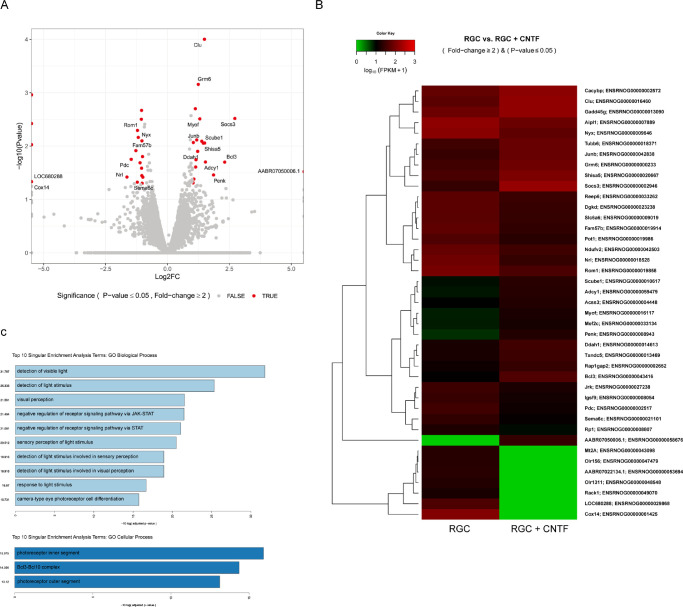
Figure 6.
RNA sequencing revealed differential gene expression and pathway analysis revealed several upregulated and downregulated pathways in ciliary neurotrophic factor (CNTF)–treated retinal ganglion cells (RGCs). (A) Volcano plot showing log2-fold change in gene expression after CNTF treatment. Each dot represents a single gene. Totally, 41 genes (19 upregulated and 22 downregulated) were identified using differential gene expression analysis (>2-fold change and adjusted P value < 0.05). (B) Heat map of gene expression in RGCs. (C) Gene Ontology (GO) biological process and cellular process analyses. Bar size indicates the level of significance for each pathway (i.e., −log[P value]).

