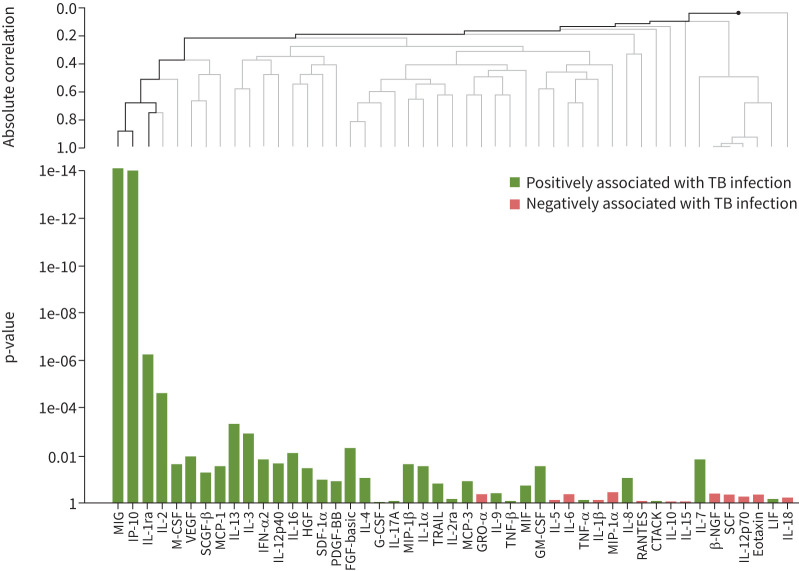
FIGURE 2.
Comparison of biomarker levels between positive versus low-negative QuantiFERON-TB Gold Plus (QFT) samples. A pairwise comparison of all cytokines, chemokines and growth factors between positive and low-negative QFT samples was conducted using global test analysis. The absolute correlation between biomarkers is depicted using hierarchal clustering. Uncorrected p-values are depicted on the left of the bar chart. Black lines on the clustering graph indicate significant multiplicity corrected p-values, while nonsignificant p-values are depicted with grey lines. Includes all data. See the bead-based multiplex assay section of the Methods for details of biomarkers included in the Bio-Plex Pro Human Cytokine Screening Panel.

