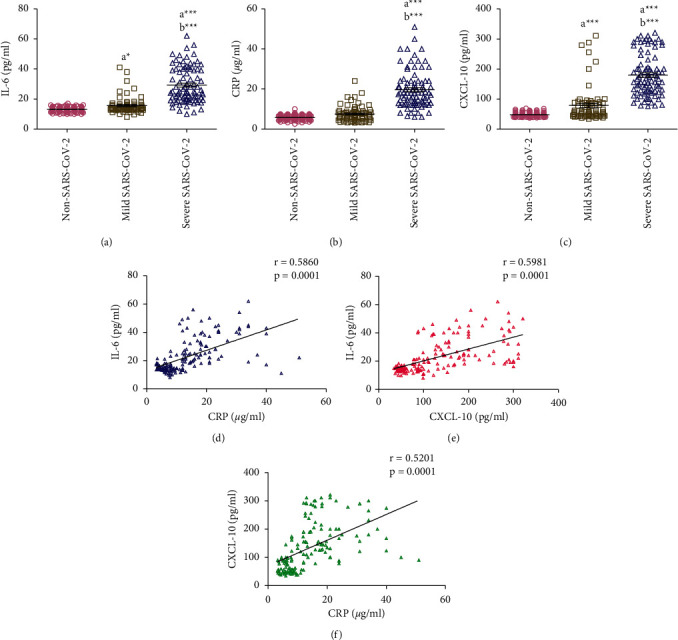
Figure 1.

(a-c) Comparison of salivary concentrations of IL-6, CRP, and CXCL-10 between non-SARS-CoV-2 (n = 142), mild SARS-CoV-2 (n = 72), and severe SARS-CoV-2 (n = 86) participants. Data were graphed as a scatter plot vertical with mean ± SE. aSignificant difference compared to non-SARS-CoV-2 participants. bSignificant difference compared to mild SARS-CoV-2 patients. ∗p < 0.05, ∗∗∗p < 0.001. (d-f) Correlation between salivary IL-6, CRP, and CXCL-10 measured in SARS-CoV-2 patients (n = 158).
