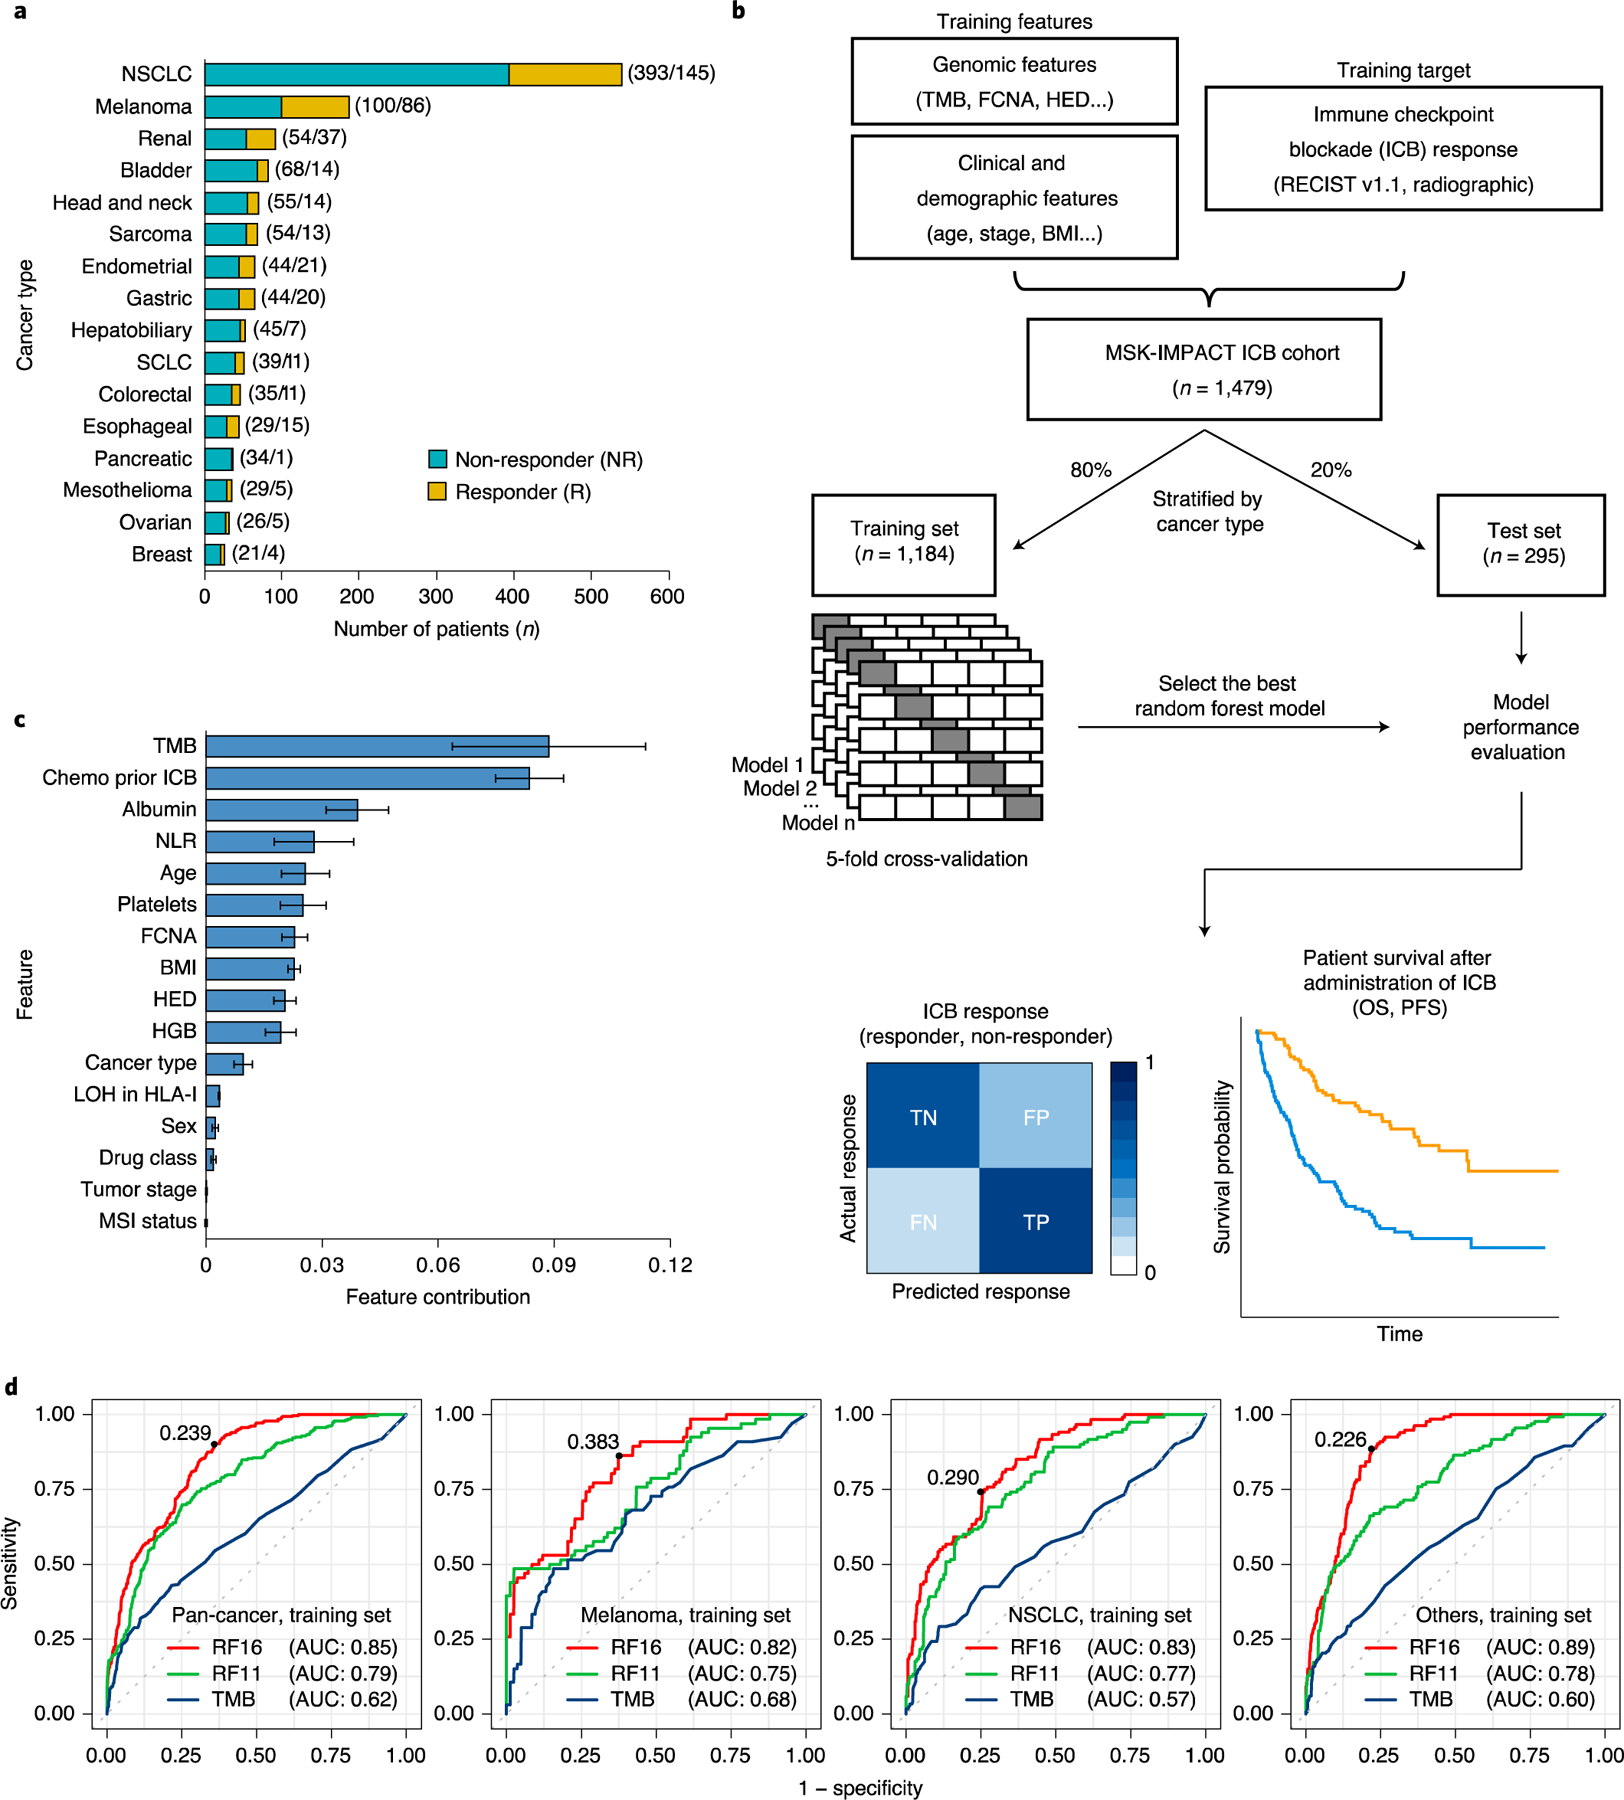
Fig. 1|. Overview of development of the model for integrated clinical-genetic prediction of ICB response.

a, Bar chart showing the number of patients in each of the 16 cancer types. We categorized response based on RECIST vl.1 (ref.12) or best radiographic response. CR and PR were classified as R; SD and PD were classified as NR. Numbers in parentheses denote the number of patients in NR and R groups, respectively. b, General overview of the random forest model training and testing procedure. Sixteen cancer types were divided into training (80%) and testing (20%) subsets individually. A random forest model was trained on multiple genomic, molecular, demographic and clinical features on the training data using five-fold cross-validation to predict ICB response (NR and R). The resulting trained model with the best hyperparameters was evaluated using various performance metrics using the test set. c, Feature contribution of the 16 model features calculated in the training set (n = 1,184) to predict ICB response. The error bars denote standard deviation of feature contribution. d, ROC curves and the corresponding AUC values of RF16, RF11 and TMB alone in the training set across multiple cancer types. The numbers on the ROC curves denote the corresponding optimal cutpoints for RF16, which maximize the sensitivity and specificity of the response prediction. SCLC, small cell lung cancer.
