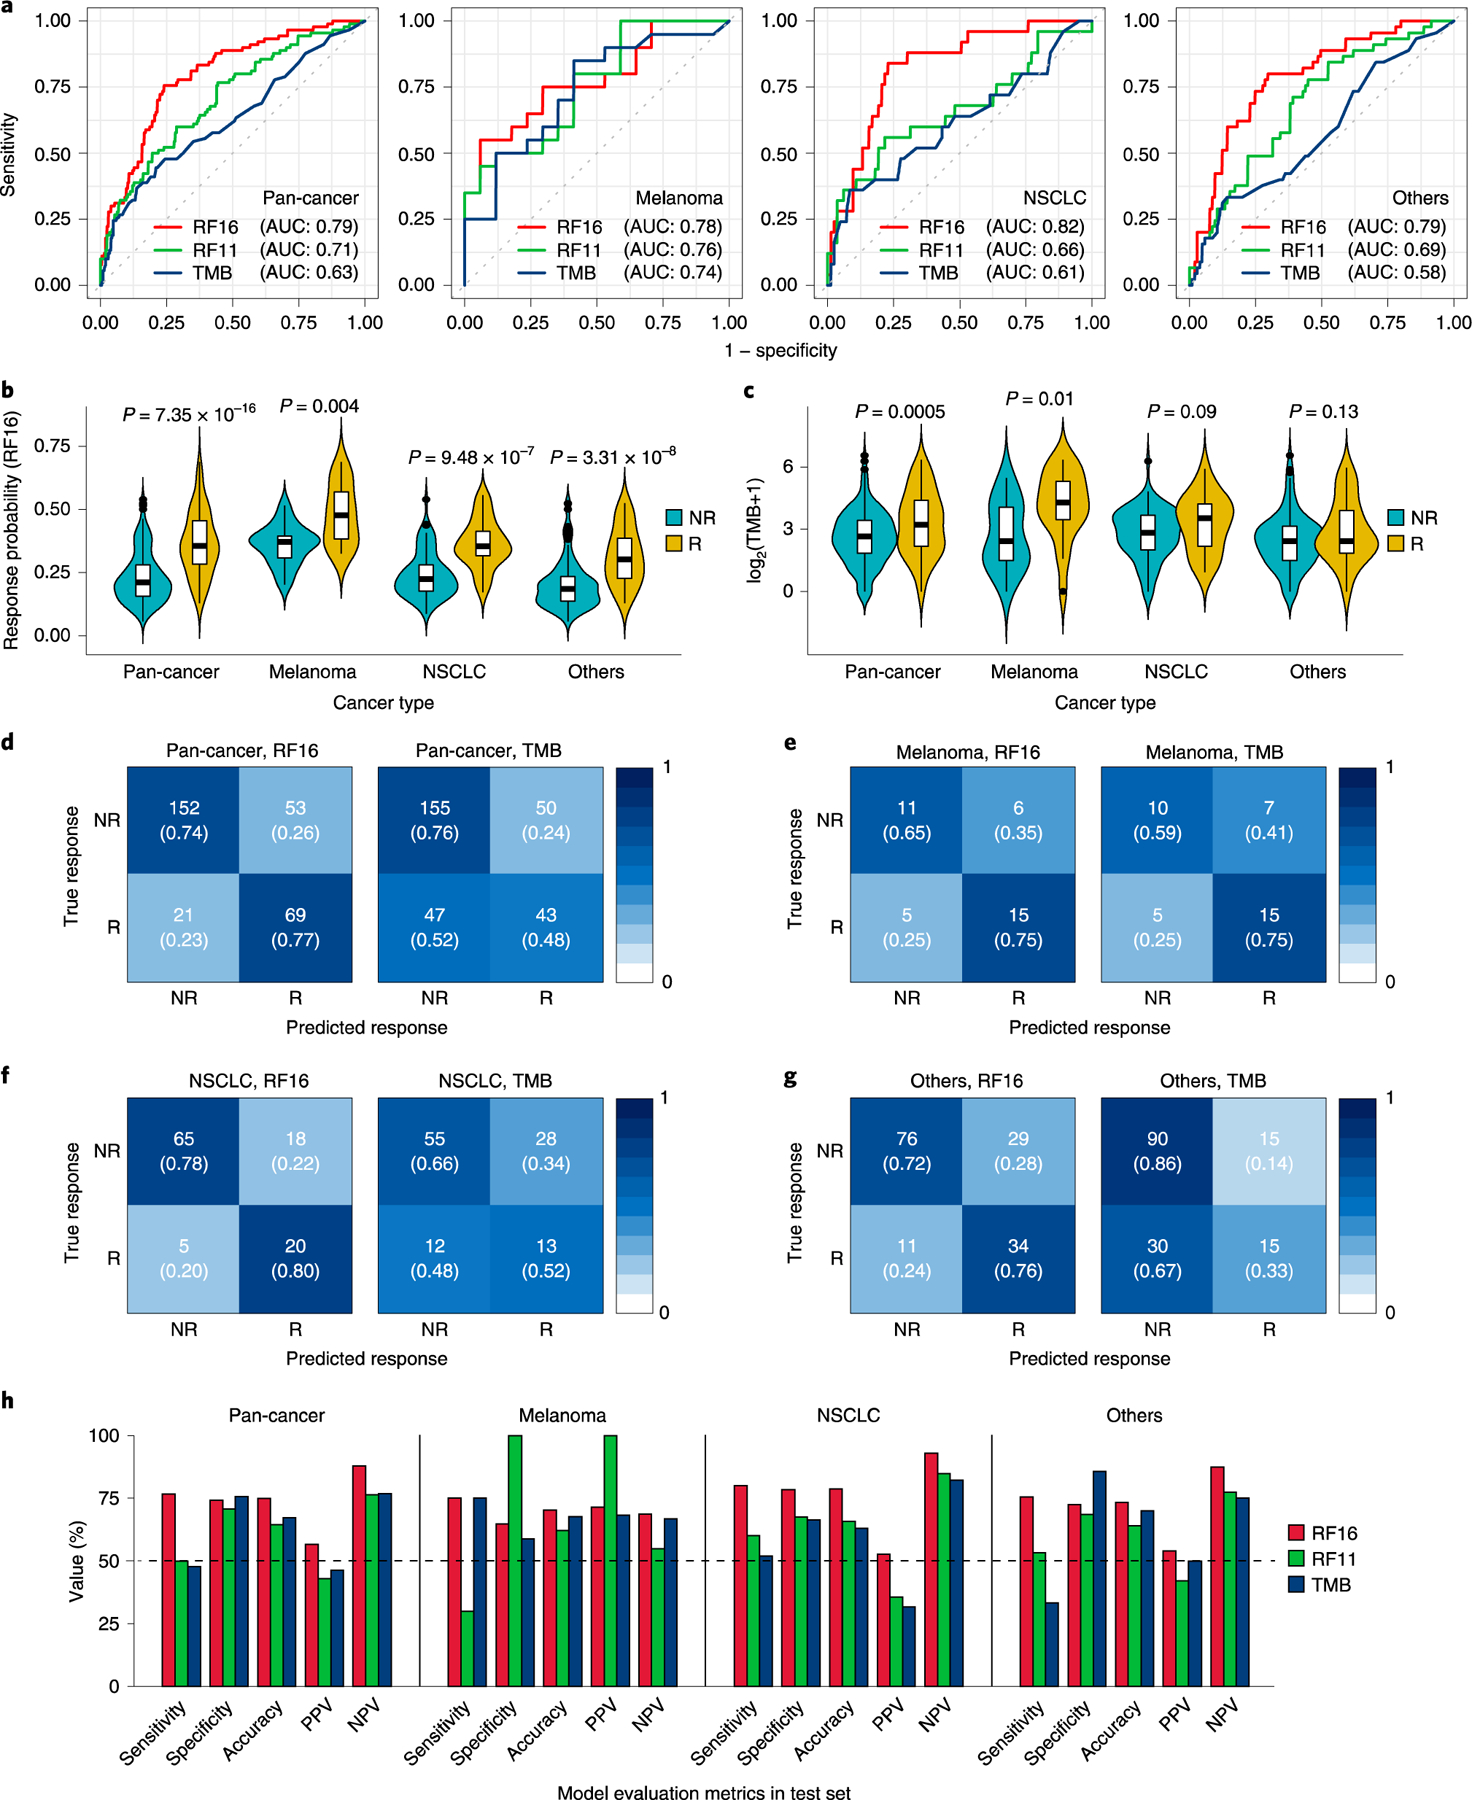
Fig. 2|. Model performance across multiple cancer types in the test set.

a, ROC curves and corresponding AUC values of RF16, RF11 and TMB alone. b, Comparison of response probability distributions calculated by RF16 between NR and R groups. Two-sided P values were calculated using the Mann-Whitney U test. Center bar, median; box, interquartile range; whiskers, first and third quartiles ±1.5x interquartile range. c, Comparison of TMB between NR and R groups. Two-sided P values were calculated using the Mann-Whitney U test. Center bar, median; box, interquartile range; whiskers, first and third quartiles ±1.5x interquartile range. d-g, Confusion matrices showing predicted outcomes generated by RF16 and TMB, as indicated, in pan-cancer (d), in melanoma (e), in NSCLC (f) and in others (not melanoma/NSCLC) (g), respectively. To define high TMB tumors, we applied the threshold of ≥10 mut/Mb, which was approved by the FDA to predict ICB efficacy of solid tumors with pembrolizumab1. h, Performance measurements of RF16, RF11 and TMB illustrated by sensitivity, specificity, accuracy, PPV and NPV.
