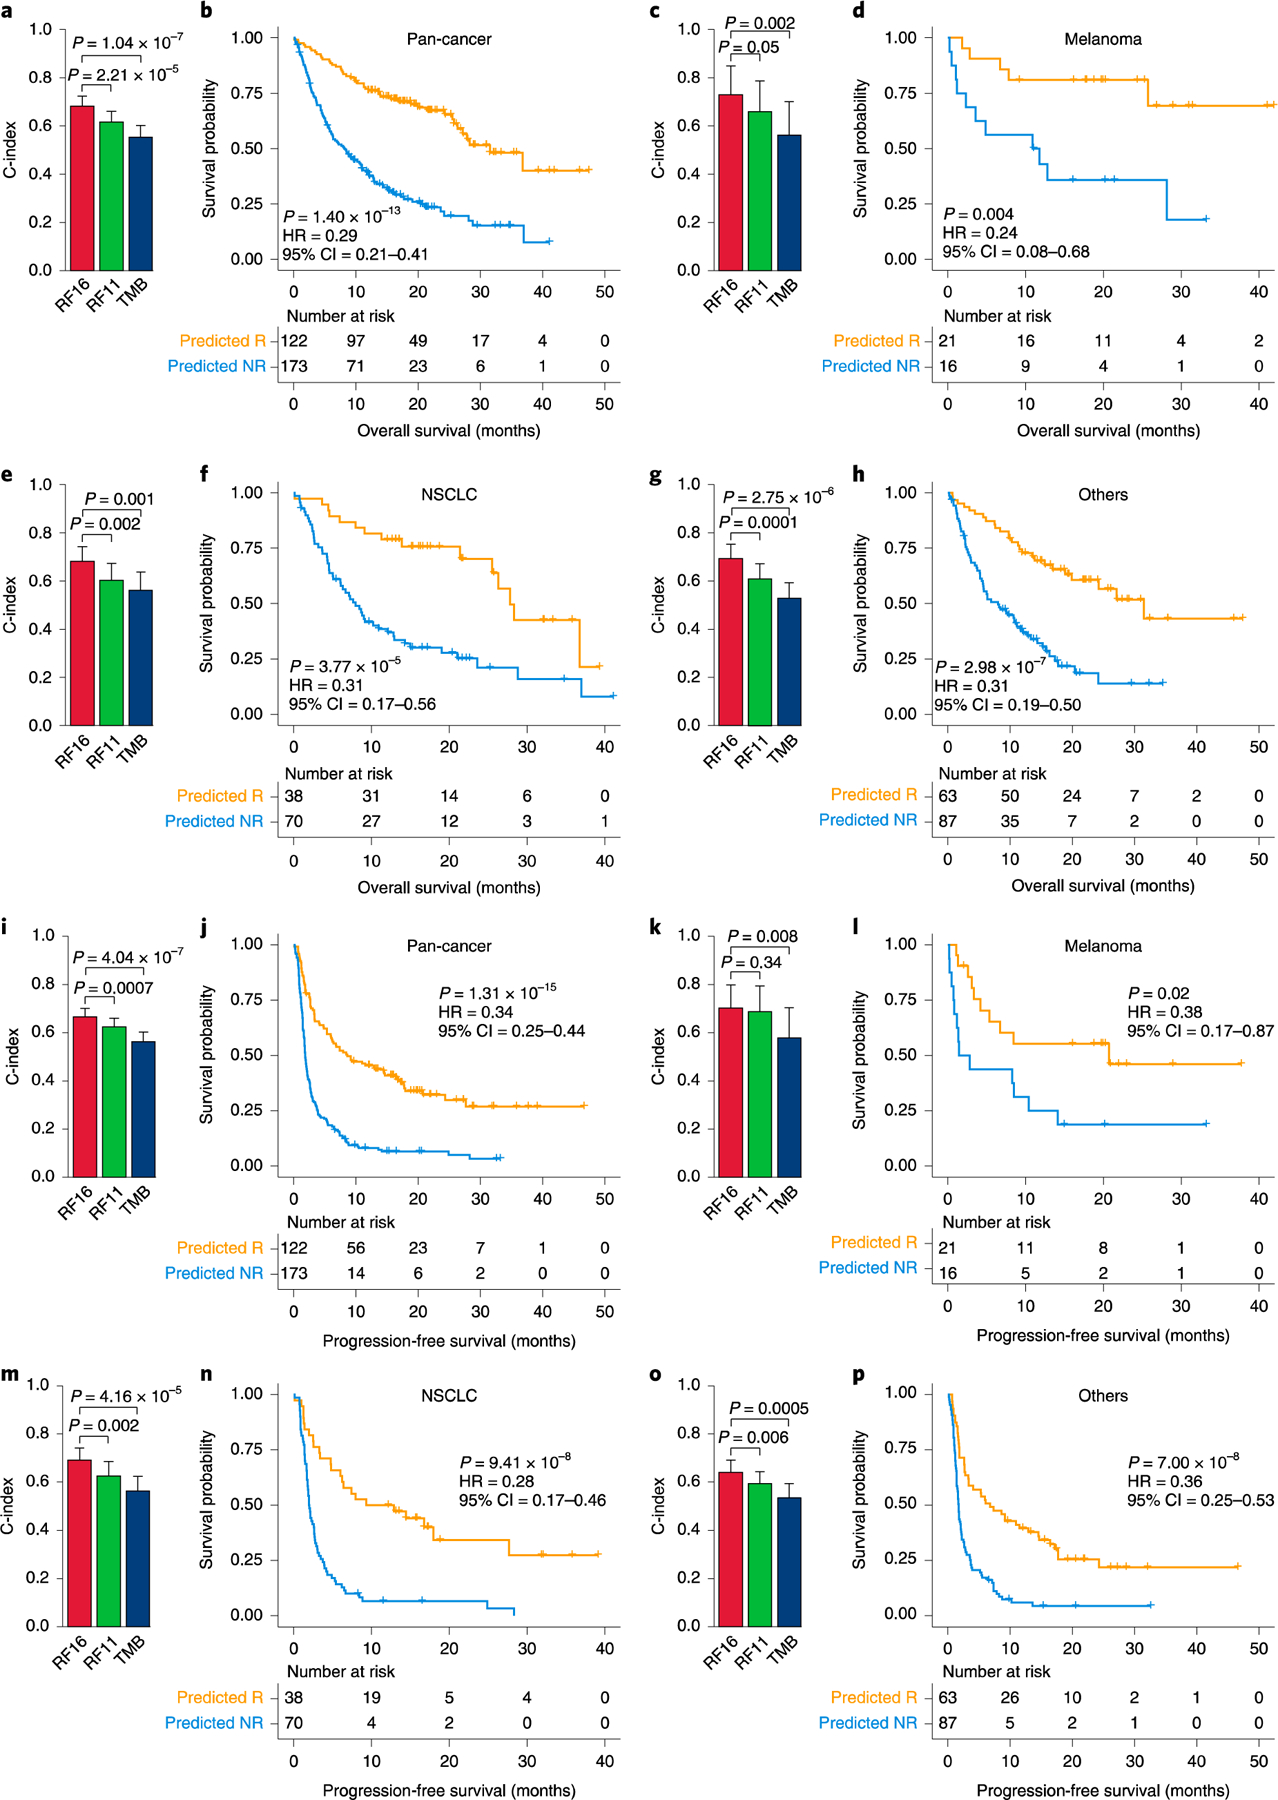
Fig. 3|. Model predicts OS and PFS across multiple cancer types in the test set.

a, Comparison of C-index and 95% Cl for predicting OS among RF16, RF11 and TMB in the pan-cancer cohort (n = 295). b, Pan-cancer association between ICB response predicted by RF16 and OS. c, Comparison of C-index and 95% Cl for predicting OS among RF16, RF11 and TMB in melanoma (n = 37). d, Association between ICB response predicted by RF16 and OS in melanoma, e, Comparison of C-index and 95% Cl for predicting OS among RF16, RF11 and TMB in NSCLC (n=108). f, Association between ICB response predicted by RF16 and OS in NSCLC. g, Comparison of C-index and 95% Cl for predicting OS among RF16, RF11 and TMB in others (not melanoma/NSCLC) (n = 150). h, Association between ICB response predicted by RF16 and OS in others. i, Comparison of C-index and 95% Cl for predicting PFS among RF16, RF11 and TMB in the pan-cancer cohort (n = 295). j, Pan-cancer association between ICB response predicted by RF16 and PFS. k, Comparison of C-index and 95% Cl for predicting PFS among RF16, RF11 and TMB in melanoma (n = 37). l, Association between ICB response predicted by RF16 and PFS in melanoma. m, Comparison of C-index and 95% Cl for predicting PFS among RF16, RF11 and TMB in NSCLC (n = 108). n, Association between ICB response predicted by RF16 and PFS in NSCLC. o, Comparison of C-index and 95% Cl for predicting PFS among RF16, RF11 and TMB in others (n = 150). p, Association between ICB response predicted by RF16 and PFS in others. Two-sided P values for comparison of C-indices and survival times were computed using the paired Student’s t-test and log-rank test, respectively.
