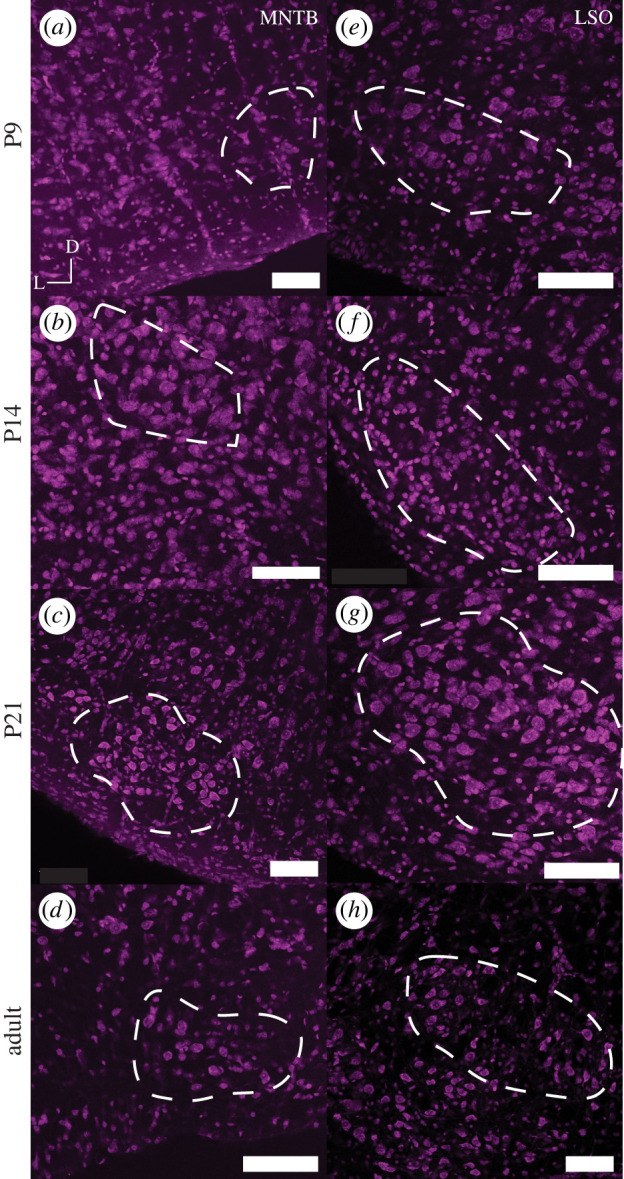
Figure 1.

Nissl staining of MNTB and LSO in naked mole-rat at P9, P14, P21 and adult stages. Each panel represents a 20x image (scale bar is 100 microns) of the MNTB (a–d) and LSO (e–h) at different developmental timepoints. D represents the dorsal direction and L the lateral orientation of the brain slice. Outlined in white is the overall shape and boundaries of the MNTB or LSO. (Online version in colour.)
