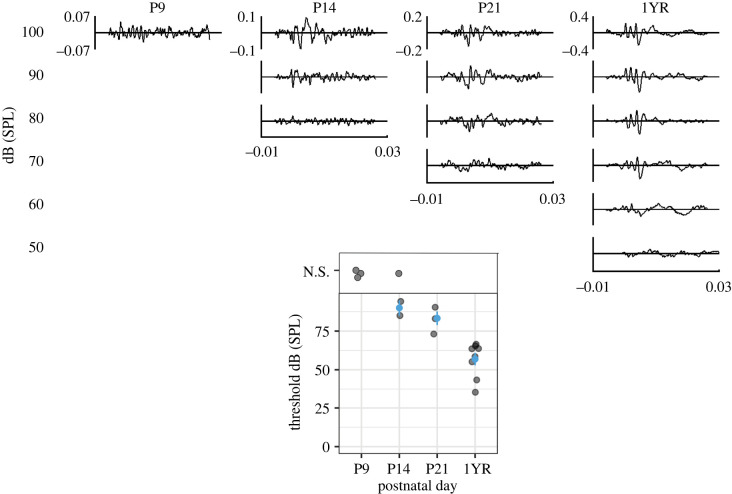
Figure 5.
ABR measurements in naked mole-rats during development. Top panel shows representative ABRs at P9, 14, 21, and approximately 1-year-old (1YR or P335–395) animals at varying intensities. Inner y-scale is microvolts and x-scale in milliseconds. Bottom panel shows the summary data for ABR thresholds at the different age groups. If no ABR waveform was detected, the animal was given a datapoint of N.S. or ‘no signal’. (Online version in colour.)

