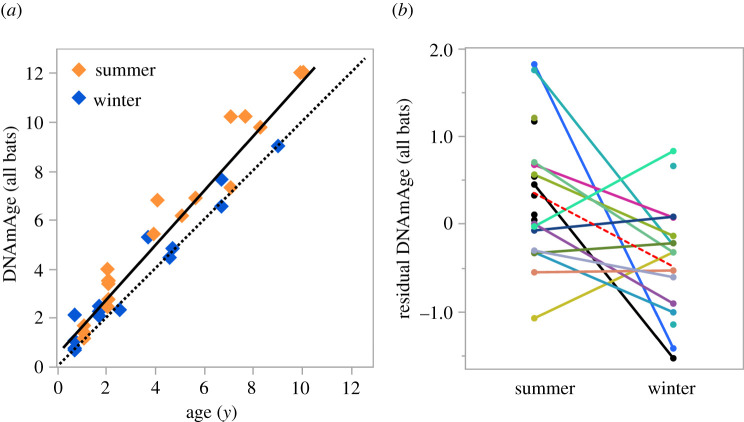
Figure 1.
Multi-species epigenetic clock applied to E. fuscus sampled in summer and winter. (a) Least-squares fit (solid line) between chronological age and biological age as predicted by a 26 bat species epigenetic clock from Wilkinson et al. [25] with the predicted chronological age indicated by the dashed y = x line. (b) Residuals from the regression in (a) plotted for each non-hibernating (summer) and hibernating (winter) bat. Solid lines connect individuals with wild-born animals labelled black. The dashed line indicates the change in mean values across seasons. (Online version in colour.)

