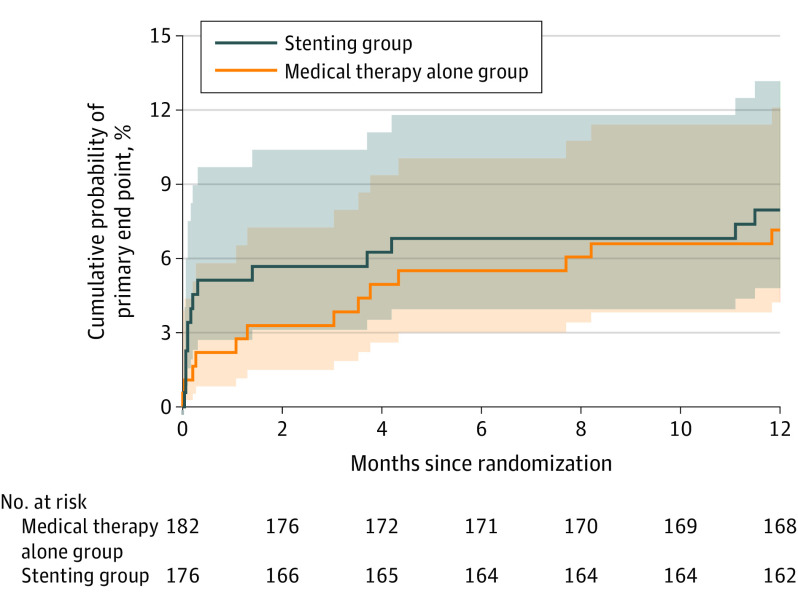
Figure 2. Kaplan-Meier Curves for the Cumulative Probability of the Primary Outcome, According to Treatment Assignment.
The primary outcome was stroke or death within 30 days after enrollment or stroke in the qualifying artery territory beyond 30 days through 1 year. One patient lost to follow-up within 1 year in the control group was treated as censored data. All other patients were followed up to event or 1 year. P = .82 for log-rank testing between the stenting and medical therapy alone groups with center as stratification factor.

