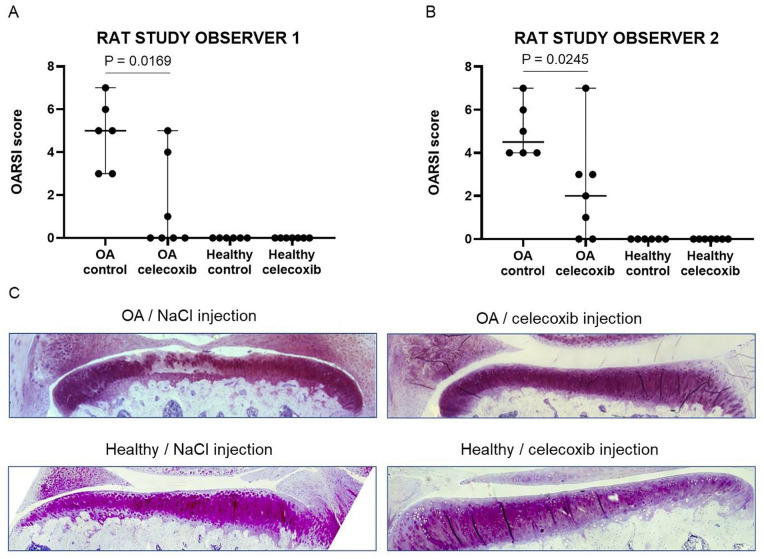
Figure 4.
Cartilage degeneration scores of rat knees treated with celecoxib or NaCl. Cartilage degeneration scoring of rat knees by observer 1 (A) and observer 2 (B), including histological images representing the largest difference of a rat knee injected with NaCl or celecoxib (C). The median and range are plotted in figures A and B. Absolute P values are depicted in the figure. N = 6 for OA and healthy with NaCl treatment. N = 7 for OA and healthy celecoxib. OA = osteoarthritis.

