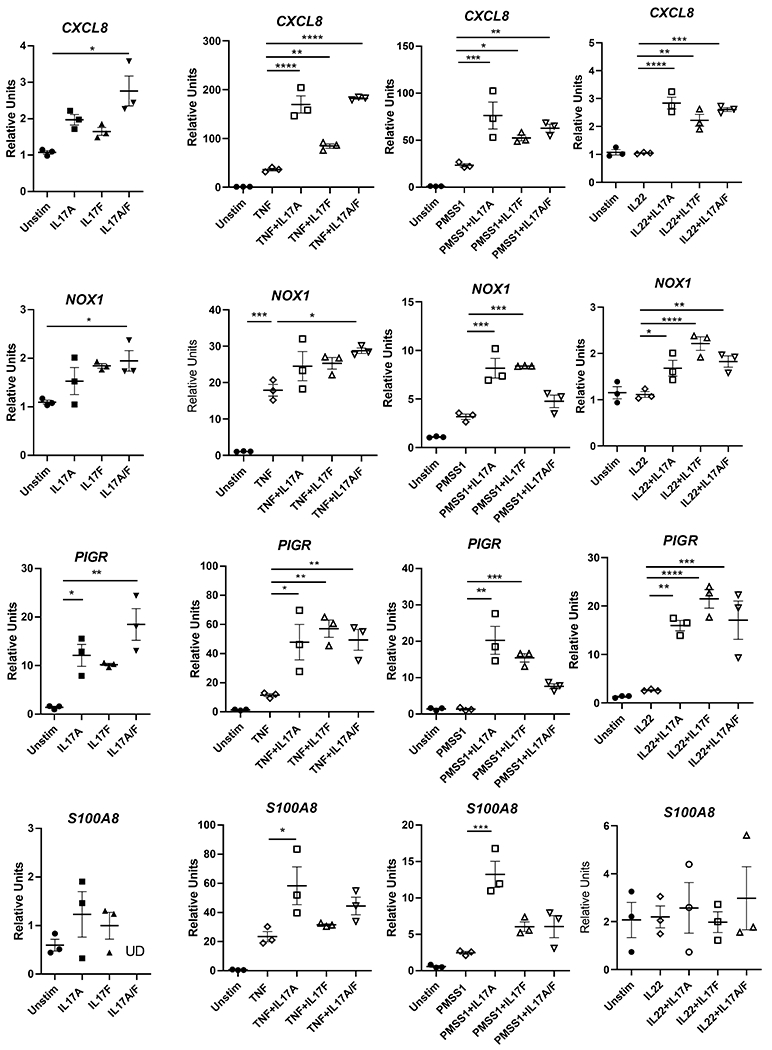
Figure 1.

Gastric epithelial cells, AGS cells, response to IL-17A, IL-17F or IL-17A/F. A. AGS cells were simulated with IL-17A, IL-17F or IL-17A/F (100ng/mL). B. Various stimuli (IL-17A at 100ug/mL, IL-17F at 100ug/ml, TNFa at 2ng/mL, IL-22 at 200ug/ml, or PMSS1 at an MOI of 50) were added to serum-starved AGS cells for 8 hours. Quantitative real-time PCR was performed to measure expression of CXCL8, PIGR, NOX1 and S100A8 in response to these stimuli or co-stimuli. Expression is shown as relative units and is relative to RNA expression from cells treated with equal concentration of the carrier (BSA). Data shown as ± SEM and are representative of 3 independent experiments. Statistical analysis was performed with one-way ANOVA and Tukey’s test for multiple comparisons.
