
Figure 3.
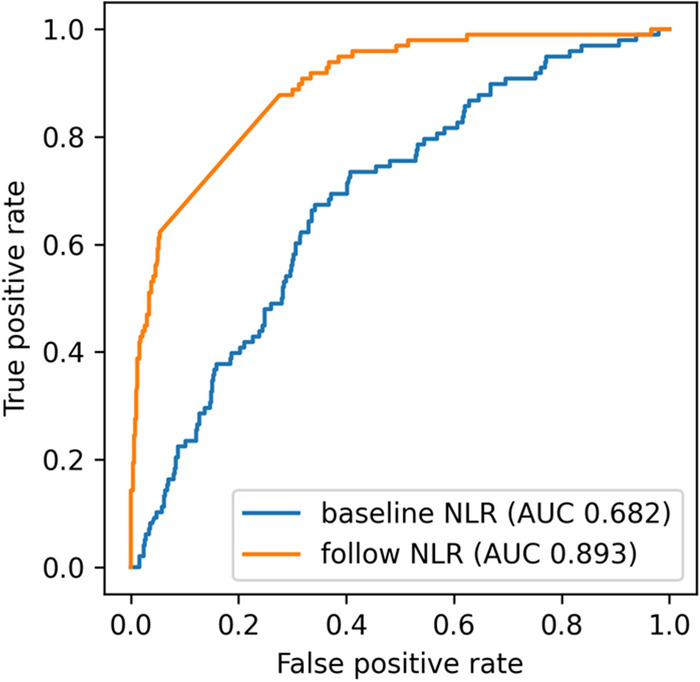
Receiver operating characteristics (ROC) for the prediction of mortality from NLR levels. ROC curves for mortality prediction were shown for baseline NLR (red) and follow-up NLR (blue) respectively. AUC, area under the curve.
Official websites use .gov
A
.gov website belongs to an official
government organization in the United States.
Secure .gov websites use HTTPS
A lock (
) or https:// means you've safely
connected to the .gov website. Share sensitive
information only on official, secure websites.
Receiver operating characteristics (ROC) for the prediction of mortality from NLR levels. ROC curves for mortality prediction were shown for baseline NLR (red) and follow-up NLR (blue) respectively. AUC, area under the curve.