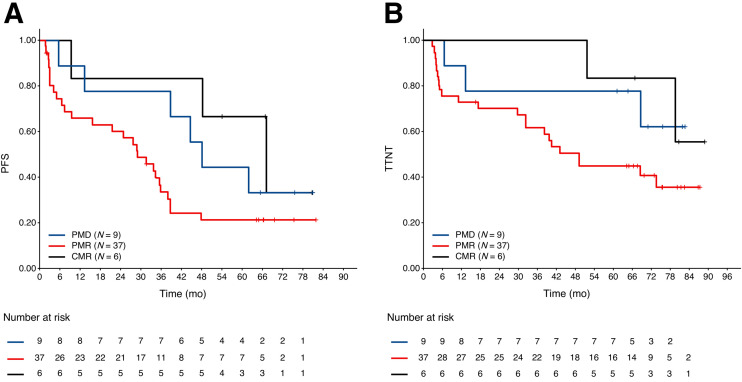
FIGURE 3.
Landmark Kaplan–Meier plots of PFS (A) and time to next antilymphoma treatment (B) at end of induction by metabolic response category in patients classified as non-CMR by independent review committee. PMD = progressive metabolic disease; PMR = partial metabolic response; TTNT = time to next antilymphoma treatment.

