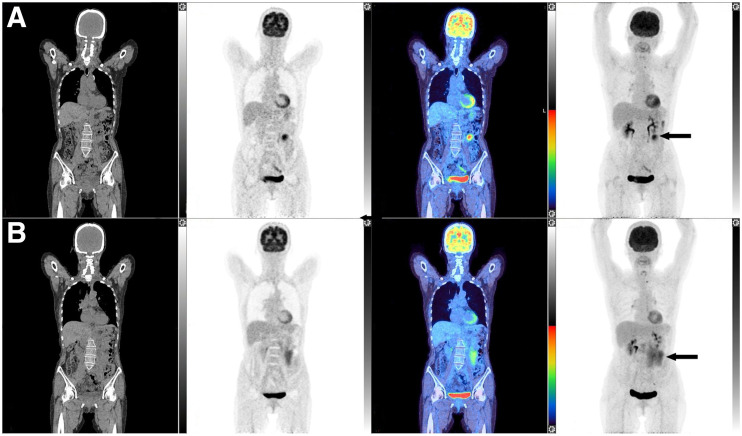
FIGURE 4.
Patient scan with CT, PET, fused, and maximum-intensity-projection coronal images, from left to right. Increased 18F-FDG uptake is seen in mesentery on end-of-induction PET/CT scan (A) (SUVmax, 11.4; arrowed in A and B), with CMR at all other sites demonstrated on baseline scan (B). Lesion measured 42 × 24 mm on contrast-enhanced CT, and patient experienced progression of mesenteric node at 5.5 mo on contrast-enhanced CT. Images are scaled to a maximum SUV of 7 for display.

