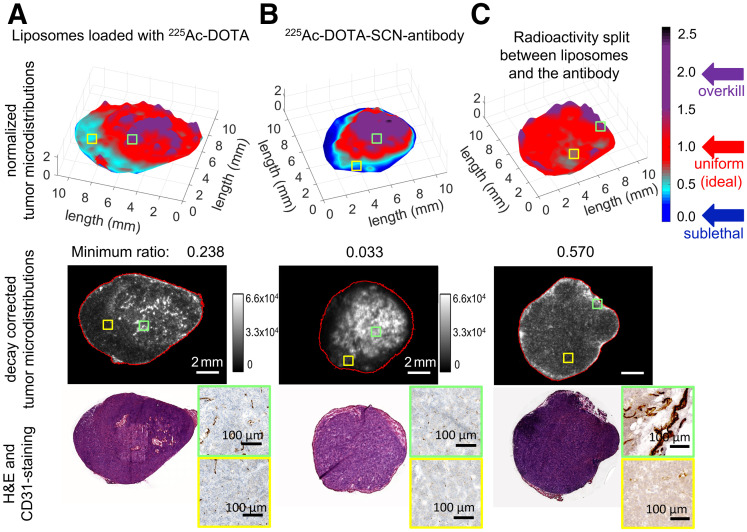
FIGURE 4.
Microdistributions of same total radioactivity of 225Ac delivered by tumor-responsive liposomes only (A), radiolabeled trastuzumab only (B), and both liposomes and—separately administered—trastuzumab (C) on tumor sections harvested 24 h after intravenous administration of 148 kBq per animal. High-radioactivity relative levels (ratios > 2, purple) were detected in densely vascularized tumor areas (CD31+, green insets); low-radioactivity relative levels (ratios < 0.6) were detected in sparsely vascularized areas (yellow insets). (Top panel) Map of normalized pixel intensities (where each pixel intensity was divided by average of intensities over entire tumor section) of 225Ac relative to intensities averaged over entire tumor section so as to evaluate range of heterogeneities in 225Ac microdistributions. Regions in red (with ratios around unity) indicate local distributions close to mean radioactivities delivered to tumor. Regions in cyan and dark blue (with normalized pixel intensity ratios well below mean radioactivities delivered to tumor) indicate regions with low or too-low radioactivities relative to tumor mean, expected to result in less cell killing. Regions in purple are where significantly more than tumor-averaged radioactivity is delivered. (Middle and bottom panels) Decay-corrected α-camera images and hematoxylin- and eosin (H&E)-stained and CD31-stained images of sequential 16-μm-thick tumor sections.

