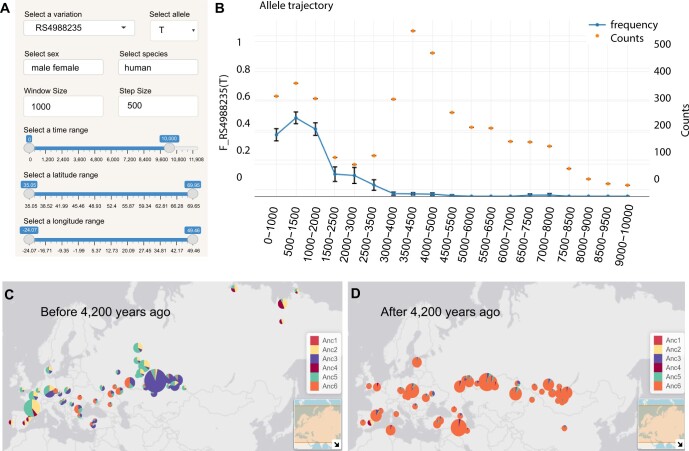
Fig. 1.
Two examples of data visualization with mapDATAge. (A) Configuration options; (B) Temporal trajectory for the T allele at the rs4988235 locus in Europeans (data from the Allen Ancient DNA Resources, https://reich.hms.harvard.edu/allen-ancient-dna-resource-aadr-downloadable-genotypes-present-day-and-ancient-dna-data). Colored dots represent the number of individuals considered in each time bin. (C) and (D) Horse ancestry profiles prior to and following 4200 years ago (data from Librado et al., 2021). Six genetic ancestry components were considered

