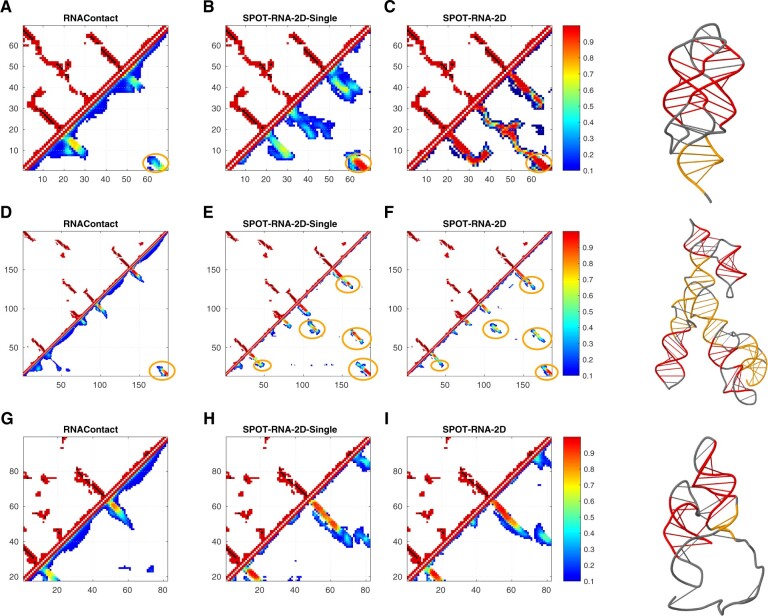
Fig. 5.
Comparison of predicted contact maps given by RNAContact (A, D, G), SPOT-RNA-2D-Single (B, E, H) and SPOT-RNA-2D (C, F, I) predicted contact map (in the lower triangle) with native contact map (in the upper triangle) for 2’-dG-II riboswitch (Chain A in PDB ID 6p2h), Varkud satellite ribozyme (Chain A in PDB ID 4r4v) and Hatchet Ribozyme (Chain A in PDB ID 6jq5) from RNA-Puzzles test set. Color bar indicates probability of predicted distance-based contact map in lower triangle. Highlighted orange circles indicate correctly predicted long-range contacts. Cartoon Figures indicate corresponding native 3D structure of upper triangular matrix on the left with long-range contacts highlighted by color orange and remaining contacts in color red (A color version of this figure appears in the online version of this article.)

