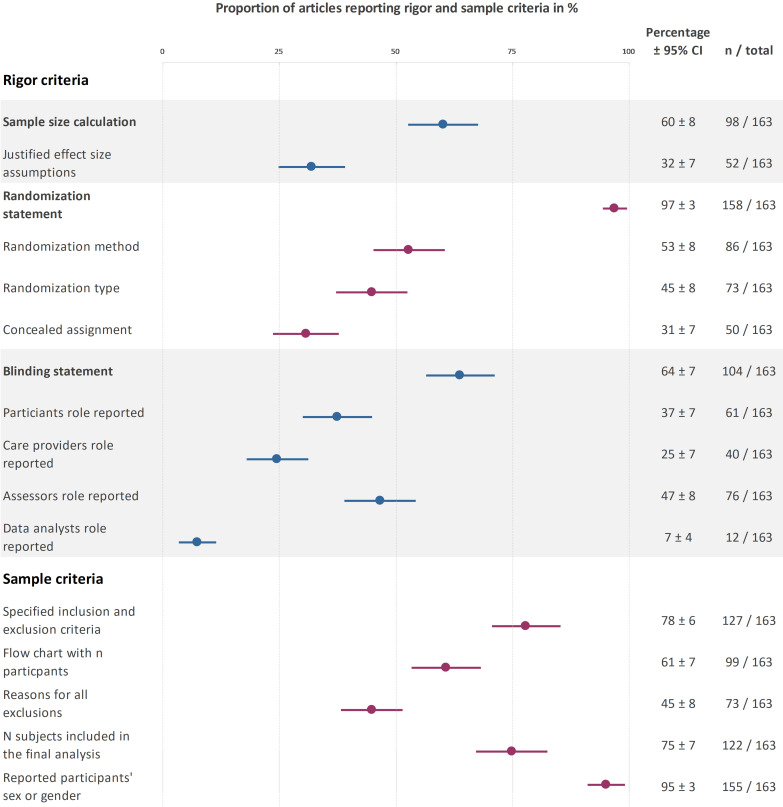
Figure 1.
Reporting prevalence for rigour and sample criteria. This plot displays the percentage of trials that addressed each criteria. For information on the actual randomisation or blinding status, please refer to the text. The different coloured data points are for better visual differentiation of each subcategory. Created by the authors.

