
Fig. 2. Multivariate and univariate analysis of the control and EtOH-consuming liver samples:
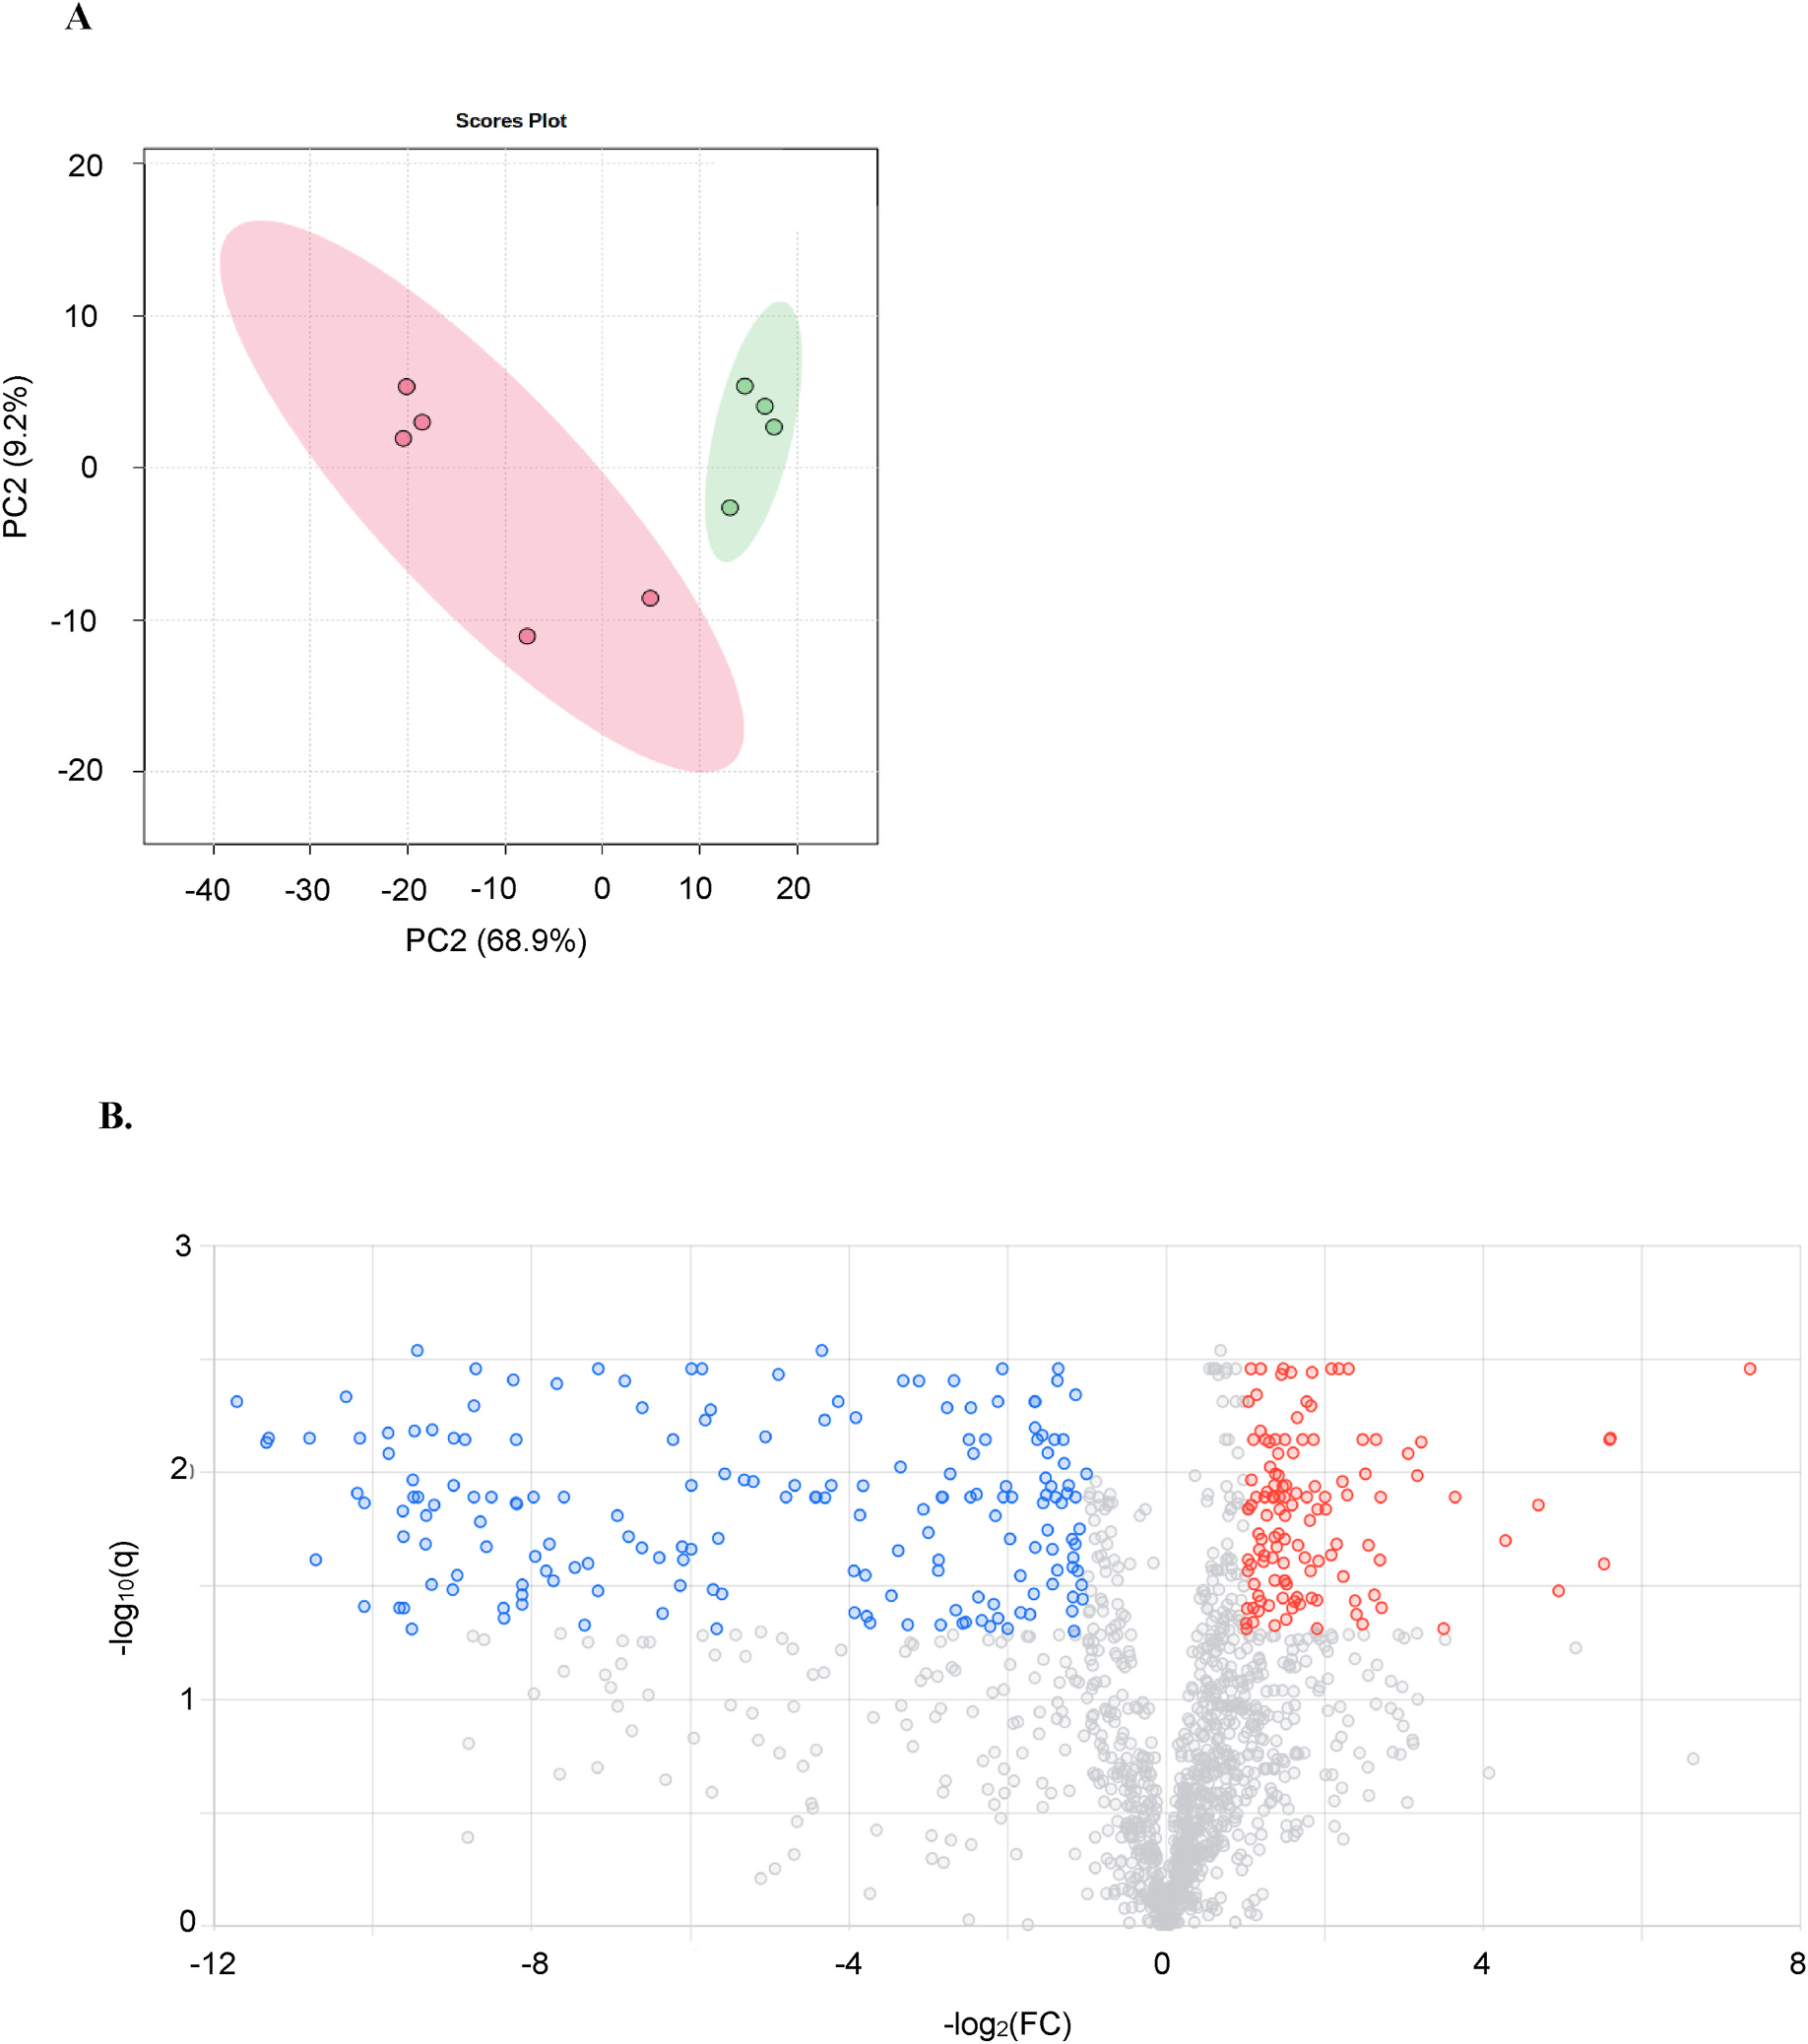
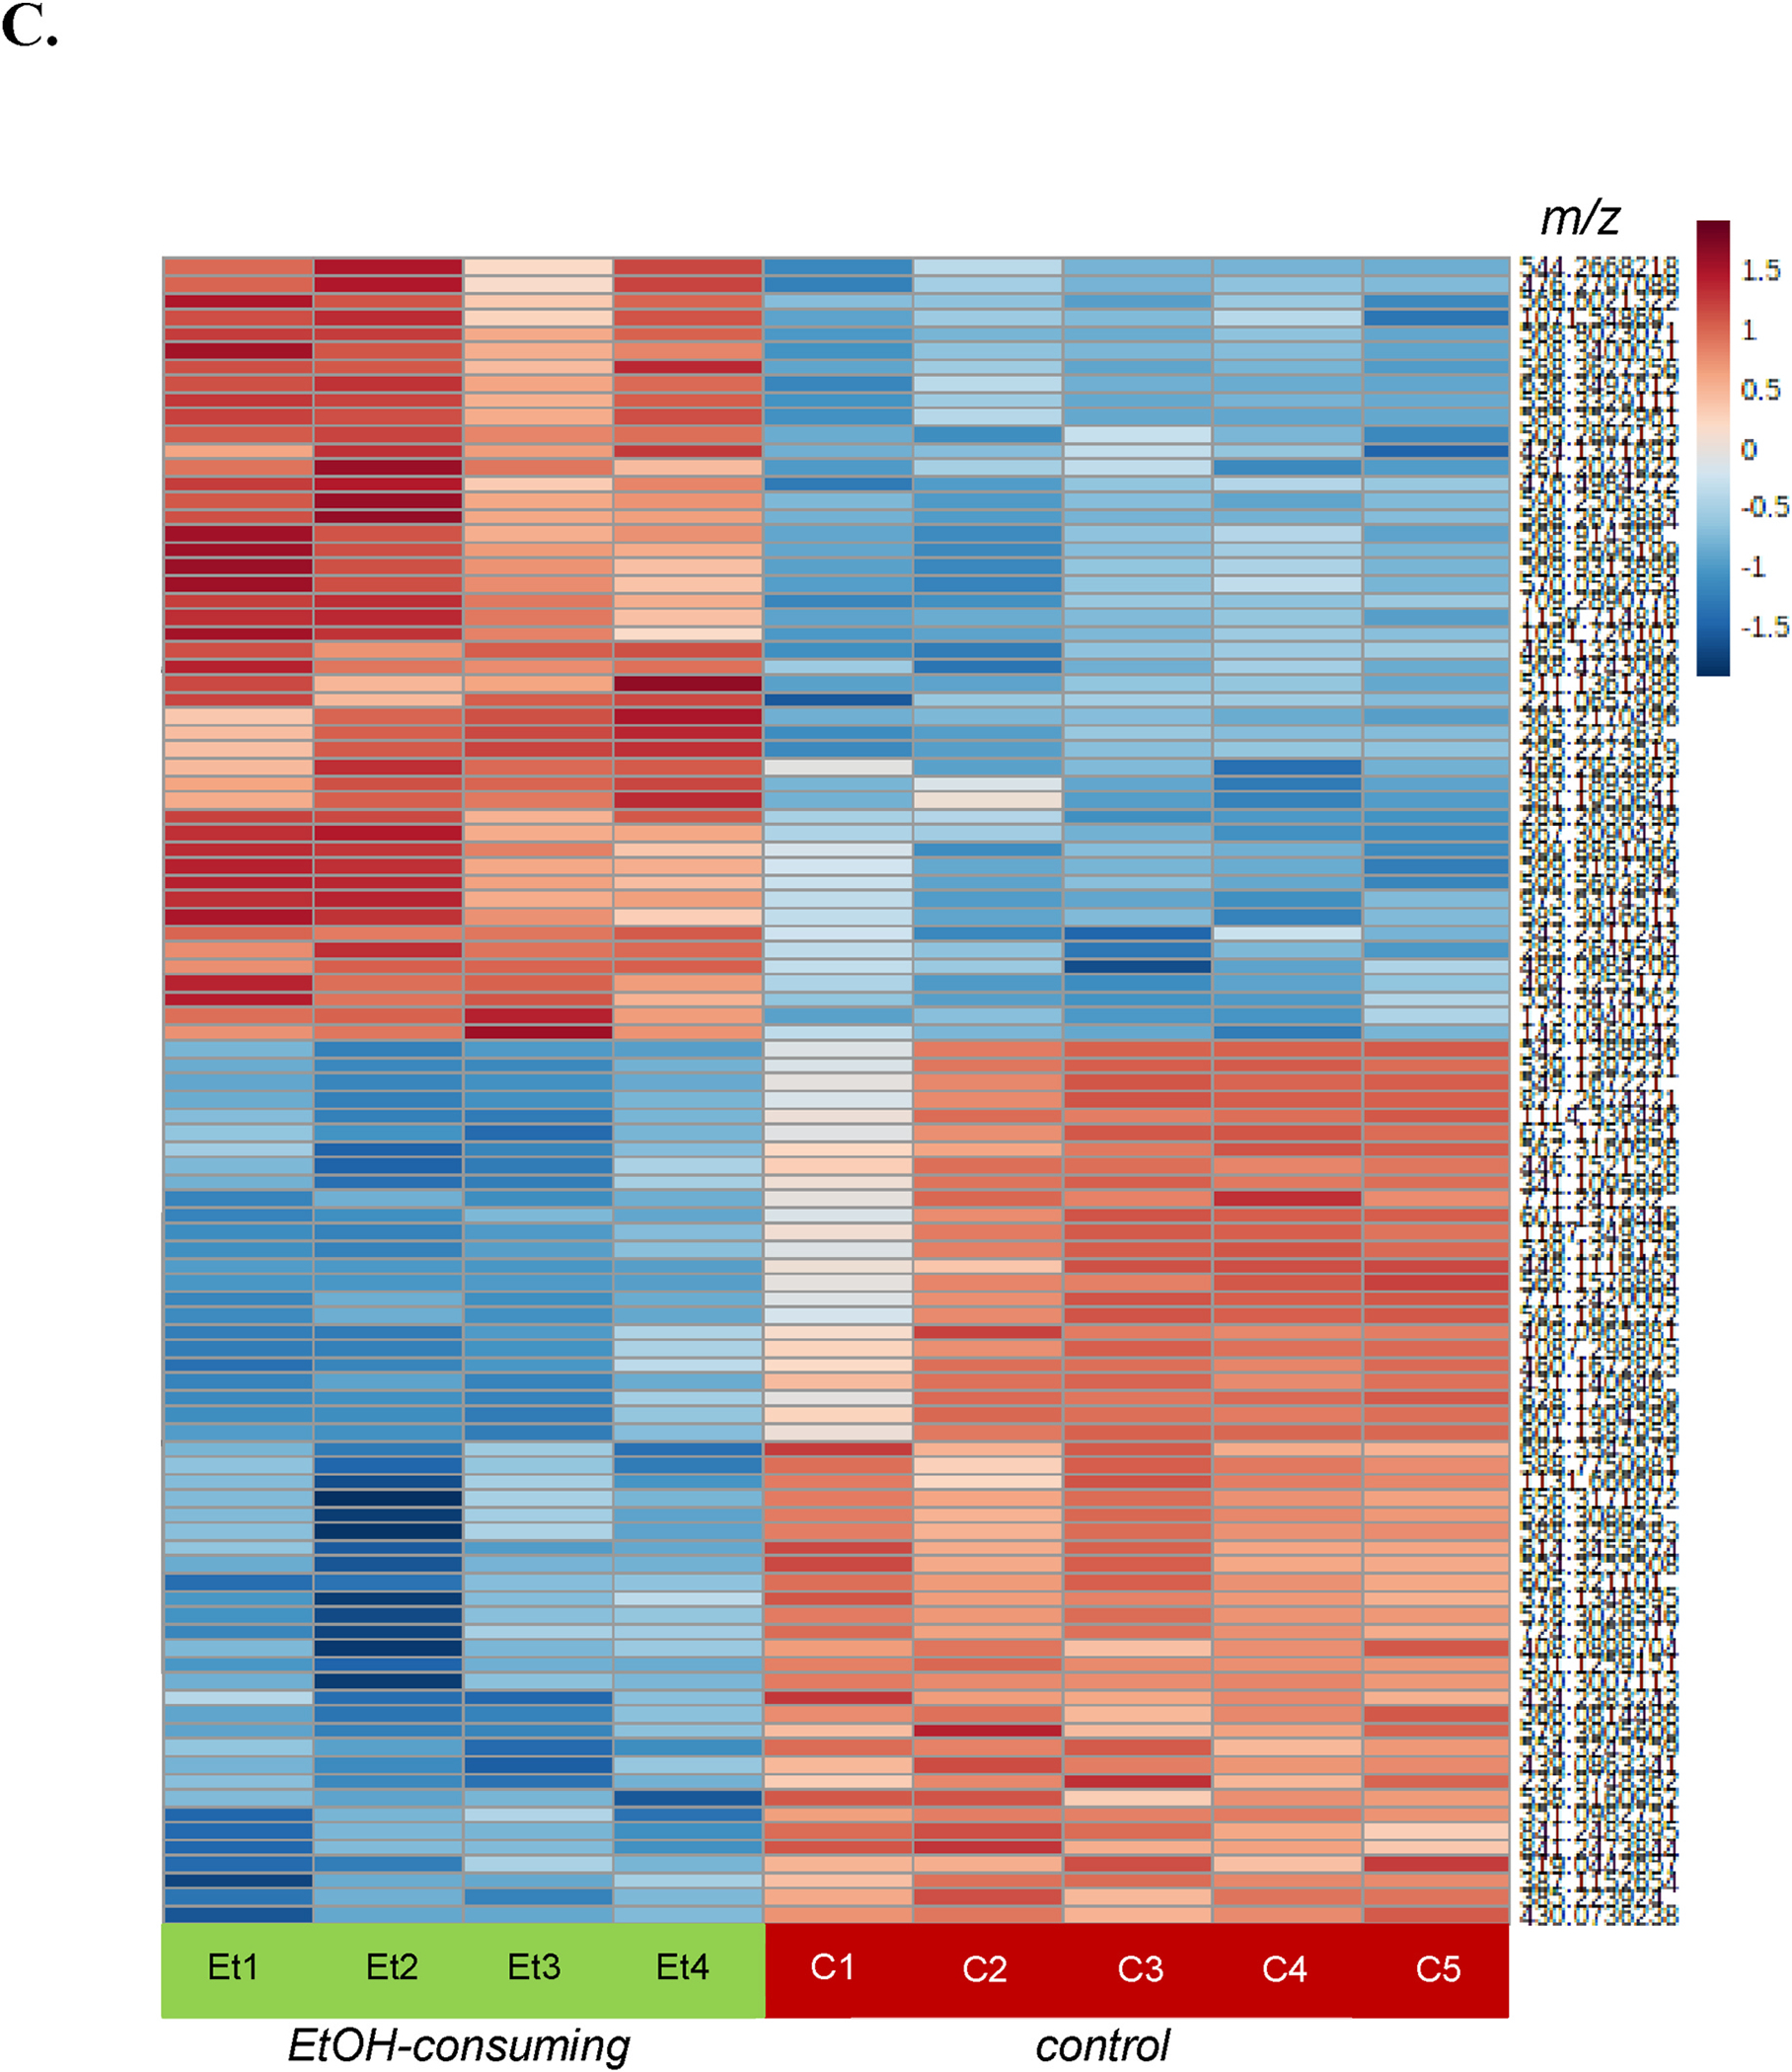
A) Principal component analysis scores plot of control (•) and EtOH-consuming (•) mice. B) Volcano plot highlighting 304 significant ions. Metabolic features that were significantly (q ≤ 0.05, univariant analysis vs. control) upregulated (red dots) or down-regulated (blue dots) in EtOH-consuming mice are shown. For the X-axis, the threshold was log2 fold-change ≥ |1| and for the Y-axis q-value ≤ 0.05. C) Heatmap of the 100 most highly significant metabolic features (i.e., m/z values) in individual control (C) and EtOH-consuming (Et) mice. Scale shows the log10 fold-change in each metabolic feature using a range from −1.5 (blue) to +1.5 (red).