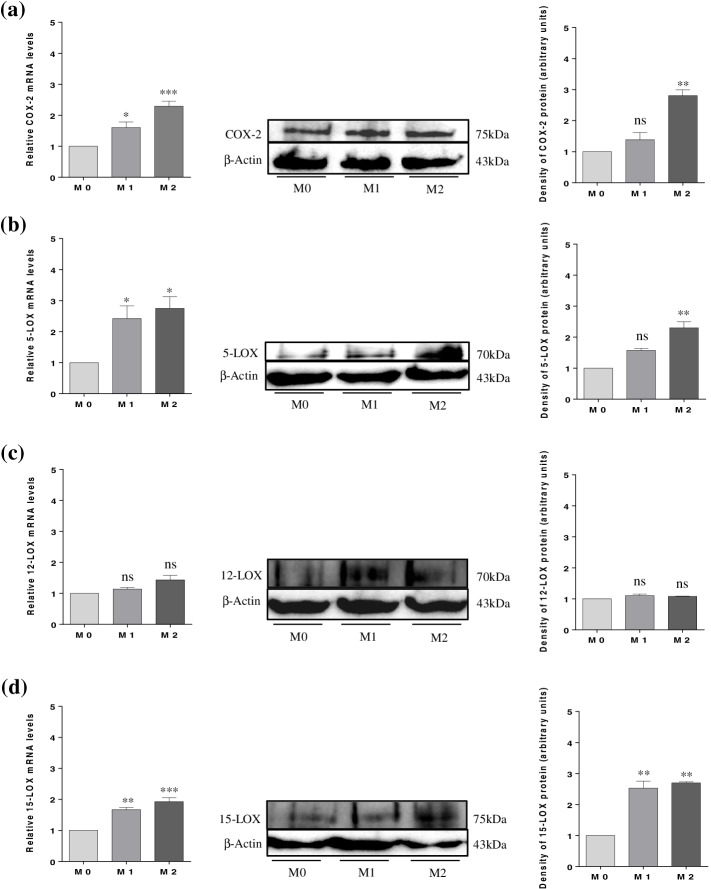
Fig. 5.
Expression of COX-2 and 5-, 12-, and 15-LOX in COV434 by mRNA and protein levels. (a) COX-2 expression; (b) 5-LOX expression; (c) 12-LOX expression; and (d) 15-LOX expression. Results are compared to the control (M0) and expressed as means ± SEM. For PCR results (n = 3, in duplicate) and for western blotting (a single representative of three independent experiments). Statistical analysis was based on one-way ANOVA, followed by a post hoc Bonferroni’s multiple comparisons test. ns: not significant. * p < 0.05, ** p < 0.01, *** p < 0.001

