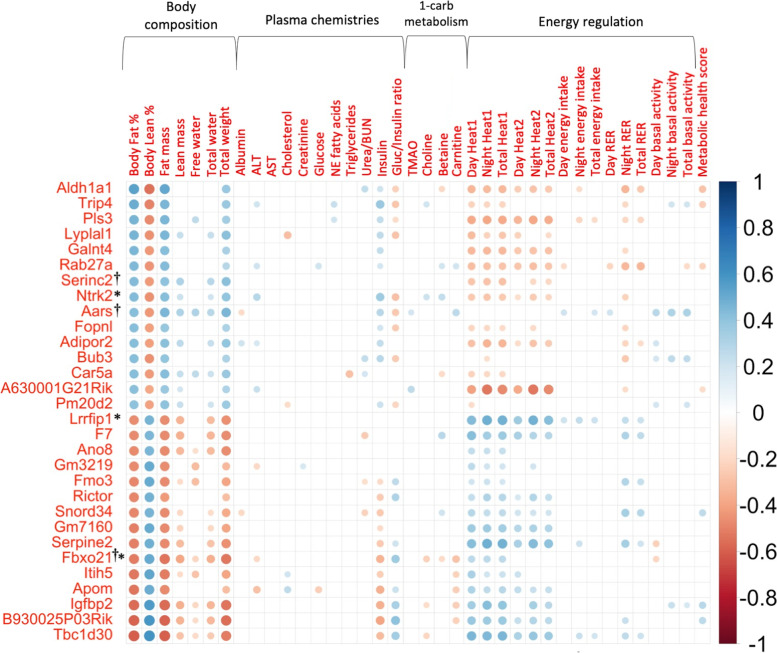
Fig. 1.
Top 30 genes with expression levels most significantly correlated with body fat %. Multiple biweight midcorrelations (bicor) and their corresponding Student correlation p-values were calculated between phenotypic data and microarray liver gene expression data to properly take into account the actual number of observations when determining which genes’ expression levels were correlated with post-diet phenotypes of interest. The top 15 genes whose expression is most significantly positively correlated with body fat % (bicor ≥ 0.410, p ≤ 2.53 × 10⁻⁶) and top 15 genes whose expression is most significantly negatively correlated with body fat % (bicor ≤ −0.466, p ≤ 5.42 × 10⁻⁸) are shown. With the exception of insulin and glucose/insulin ratio, most of the top 30 genes’ expression most significantly correlated with body fat % were not significantly correlated with circulating analytes but were significantly correlated with metabolic (energy regulation) traits. Genes are ordered on the y-axis in descending order of bicor with the strongest positive correlation at the top and the strongest negative correlation at the bottom. Scale indicates bicor value with color darkness as indicator of correlation strength. †Indicates genes that are also differentially expressed by diet; all 30 genes were found to be differentially expressed by strain. *Indicates genes found to be associated with at least one obesity-related trait in humans according to the GWAS catalog. Annotation for all genes with expression significantly correlated with body fat % are shown in Supplementary Table 1, Additional file 2. All significant correlations in this figure are shown in Supplementary Table 2, Additional file 2

