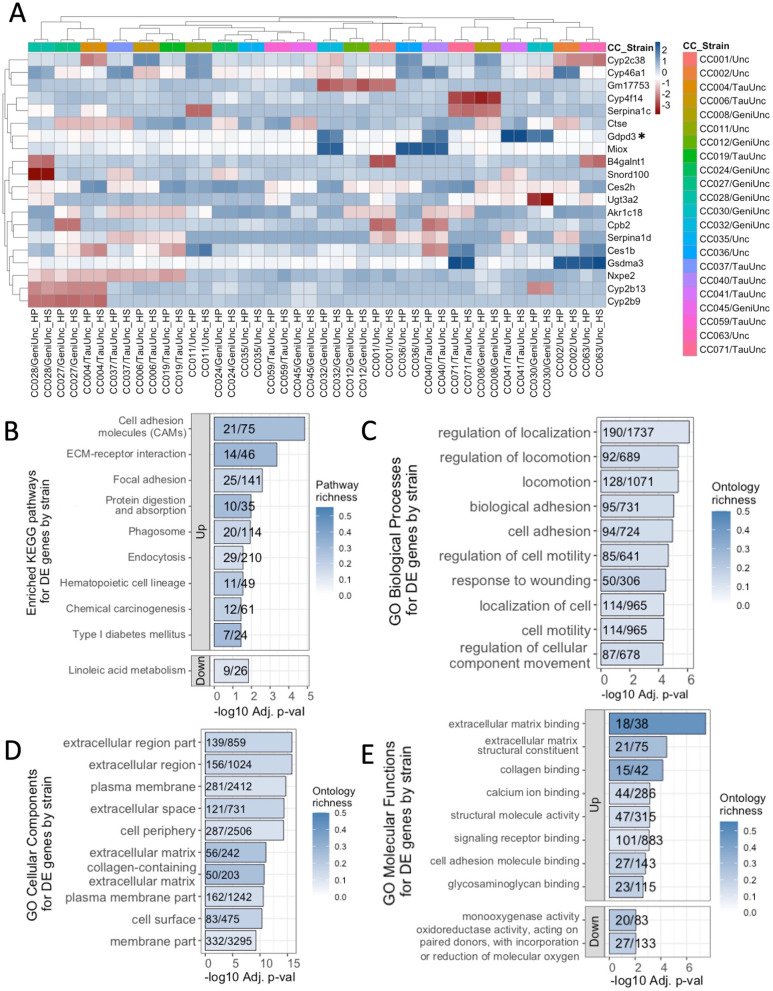
Fig. 3.
Expression patterns and enrichment of transcripts differentially expressed by CC strain. A The top 20 most significant (BH-adjusted p ≤ 2.631 × 10−56) strain DE genes’ average Z scores of median robust multi-array average (RMA) normalized, gene expression for each CC strain on either the high-protein (HP) or high-fat high-sucrose (HS) diet shown. Gene average RMA Z scores for each CC strain and diet are clustered according to Euclidean distance by CC strain and diet on the x-axis and by gene on the y-axis. The human homolog of Gdpd3 was found in the GWAS catalog to be associated with at least one obesity-related trait. Annotation and limma results are shown for all strain DEGs in Supplementary Table 5, Additional file 2. Limma analysis of microarray data revealed genes differentially expressed by strain showing significant enrichment (p adj < 0.05) for B KEGG (13 total), C GO biological pathways (95 total), D GO cellular components (44 total), and E GO molecular functions (24 total). Pathways are ordered from top to bottom by significance (highest to lowest) and colored by gene richness. The top 10 enrichments for each ontology category were all upregulated on the HP diet, except for the linoleic acid metabolism KEGG pathway, and GO molecular functions “monooxygenase activity” and “oxidoreductase activity, acting on paired donors…,” which were downregulated. All significant enrichment terms and enrichment analysis results are shown in Supplementary Table 6, Additional file 2

