Fig. 3.
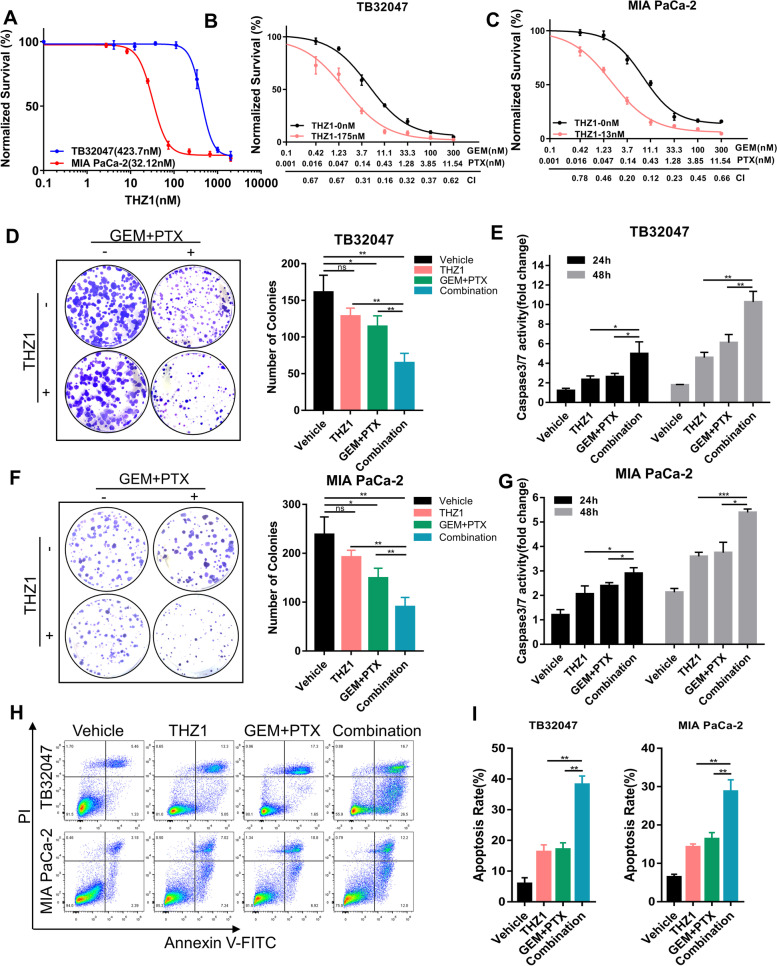
Targeted inhibition of CDK7 enhanced gemcitabine and paclitaxel chemotherapy response in pancreatic cancer in vitro. A Dose–response curves of TB32047 and MIA PaCa-2 wild-type cells to THZ1. Cell proliferation was evaluated 72 h after drug treatment. Data are presented as the mean of three independent experiments (n = 3). B and C The CDK7 inhibitor THZ1 enhances the antiproliferative impact of GEM and PTX in pancreatic cancer cells synergistically. Proliferation analysis was performed on TB32047 (B) and MIA PaCa-2 (C) cells treated for 72 h with THZ1 and GEM/PTX alone or in combination. The plot of fraction affected versus combination index is shown below the x-axis. CI < 1.0, synergism. D and F Clonogenic assay of TB32047 (D) and MIA PaCa-2 (F) cells treated with vehicle or drugs for 72 h and cultured without drugs for an additional 7–10 days. The cells remaining after the treatment were fixed and stained with crystal violet. Representative images (left) and quantifications (right) of three independent experiments (n = 3) are shown. * p < 0.05 and ** p < 0.01 by one-way ANOVA with a Tukey multiple comparison test. ns: not significant. E and G. Caspase 3/7 activity was evaluated in TB32047 (E) and MIA PaCa-2 (G) cells treated for 72 h with vehicle or drugs. Data are presented as mean ± SD (n = 3). * p < 0.05, ** p < 0.01, and *** p < 0.001 by two-way ANOVA with a Tukey multiple comparison test. H and I Flow cytometry-based apoptotic assay of TB32047 and MIA PaCa-2 cells treated for 72 h with drugs or drug combination for 72 h. Representative images (H) and quantification (I) of three independent experiments (n = 3) are shown. ** p < 0.005 by two-way ANOVA with a Tukey multiple comparison test

