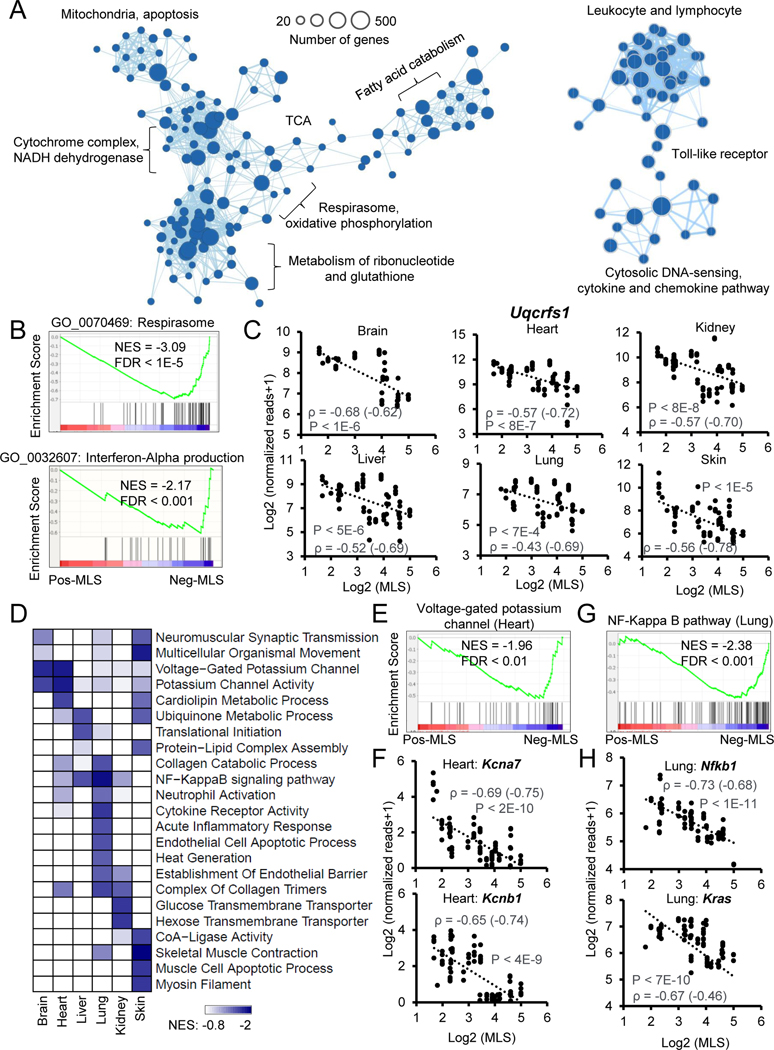
Figure 2. Functional enrichments of genes negatively correlated with MLS.
(A) The enrichment map networks visualization of genes that negatively correlate with MLS across six tissues. Each dot represents a Gene Ontology (GO) or KEGG functional term. Two functional terms are connected in the enrichment map network if they have a high overlap of genes. Groups of inter-related functional terms tend to cluster together. The dot sizes indicate the number of genes in a specific term.
(B) GSEA showing global enrichment of GO terms including Respirasome (upper panel) and Interferon-Alpha production (lower panel) in Neg-MLS genes. Normalized enrichment scores (NES) and false discovery rate (FDR) values are shown.
(C) Scatter plots showing the relative expression levels of a respiratory chain gene Uqcrfs1 in six tissues across species. Spearman correlation coefficients (ρ) of gene expression and MLS are shown in the plots. ρ calculated with gene expression after phylogenetically independent contrasts are shown in parenthesis.
(D) The heatmap showing the tissues-specific functional enrichments of Neg-MLS genes. Colors indicate NES values from GSEA in each tissue. Functional terms enriched across all tissues (A) are not shown here to avoid redundancy.
(E) GSEA showing specific enrichment of voltage-gated potassium channel in the Neg-MLS genes in the heart. NES and FDR values are shown.
(F) Scatter plots showing the relative expression level of potassium voltage-gated channel subfamily genes Kcna7 and Kcnb1 in the heart across species.
(G) GSEA showing specific enrichment of NF-Kappa B pathway in the Neg-MLS genes in the lung. NES and FDR values are shown.
(H) Scatter plots showing the relative expression levels of key regulators in NF-Kappa B pathway including Nfkb1and Kras in the lung across species.

