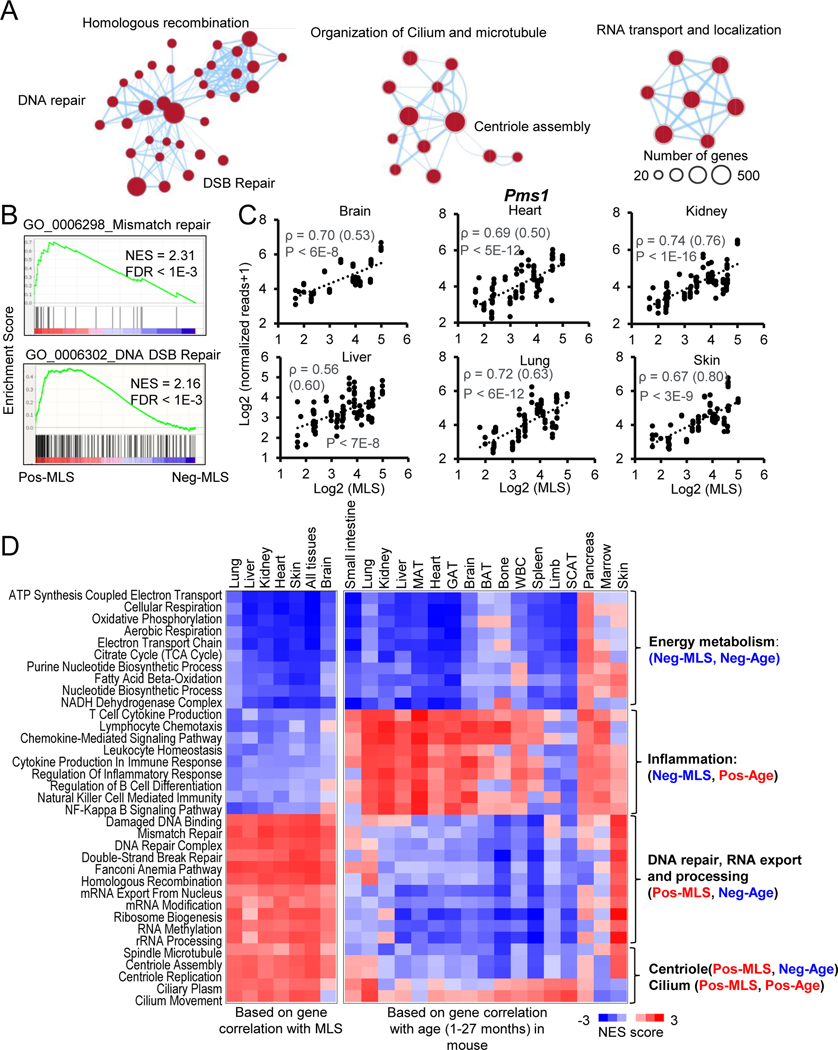
Figure 3. Functional enrichments of genes positively correlated with MLS.
(A) The enrichment map networks visualization of genes that are positively correlated with MLS across six tissues. Each dot represents a GO and KEGG functional term. Two functional terms are connected in the enrichment map network if they have a high overlap of genes. Groups of inter-related functional terms tend to cluster together. The dot size indicates the number of genes in a specific term.
(B) GSEA plots showing global enrichment of representative GO terms including mismatch repair and DNA DSB Repair. NES and FDR values are shown.
(C) Scatter plots showing the relative expression levels of a DNA mismatch repair gene Pms1 in six tissues across species. Spearman correlation coefficients (ρ) of gene expression and MLS are shown. Phylogenetically corrected values for ρ are shown in parenthesis.
(D) The heatmap showing NES of MLS-associated pathways based on the correlation of gene expression with MLS (left) and age (right). Negative NES values shown as Blue indicate expression of genes involved in this pathway tends to negatively correlate with MLS or/and age, i.e. downregulated during mouse aging. Positive NES values shown as Red indicate expression of genes involved in this pathway tends to positively correlate with MLS or/and age, i.e. upregulated during mouse aging.

