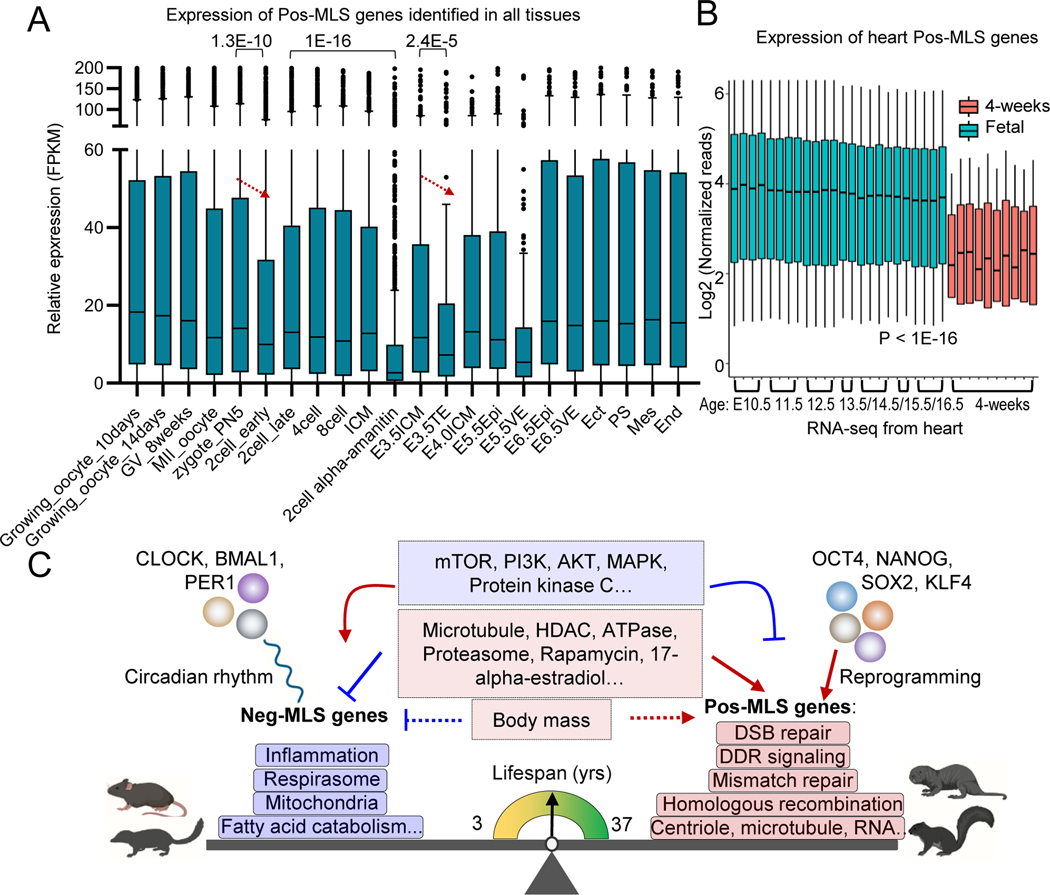
Figure 7. Conserved genes and pathways controlling lifespan across mammalian species.
(A) Boxplot showing the dynamic expression of Pos-MLS genes identified in all tissues during preimplantation development and gastrulation. Gene expression of Pos-MLS genes shows significant downregulation in TE compared to E3.5ICM during embryonic development. p values were calculated using a two-tailed Student’s t-test. RNA-seq data of gastrulation are from (Zhang et al., 2018). RNA-seq data of preimplantation development are from (Wu et al., 2016). ICM: inner cell mass. TE: trophectoderm. Epi: epiblasts. VE: visceral endoderm. Ect: ectoderm. PS: primitive streak. Mes: mesoderm. End: endoderm.
(B) Boxplot showing the expression of Pos-MLS genes identified in the heart. Gene expression of the fetal heart is shown as light blue. Gene expression of the postnatal heart (4-weeks old) is shown as orange. p values were calculated using a two-tailed Student’s t-test.
(C) Across species, gene expression is differentially regulated and highly correlated with MLS. Genes involved in respirasome, mitochondria, and fatty acid catabolism-related functions show higher expression in short-lived mammals. In comparison, genes involved in DNA damage response (DDR), DSB repair, mismatch repair, homologous recombination and centriole and microtubule-related functions tend to be upregulated in long-lived species. Neg-MLS and Pos-MLS also show distinct responses to interventions and are regulated by distinct transcriptional regulatory networks. Neg-MLS are regulated by circadian transcription factors while Pos-MLS genes are regulated by pluripotency factors.
See also Figure S7

