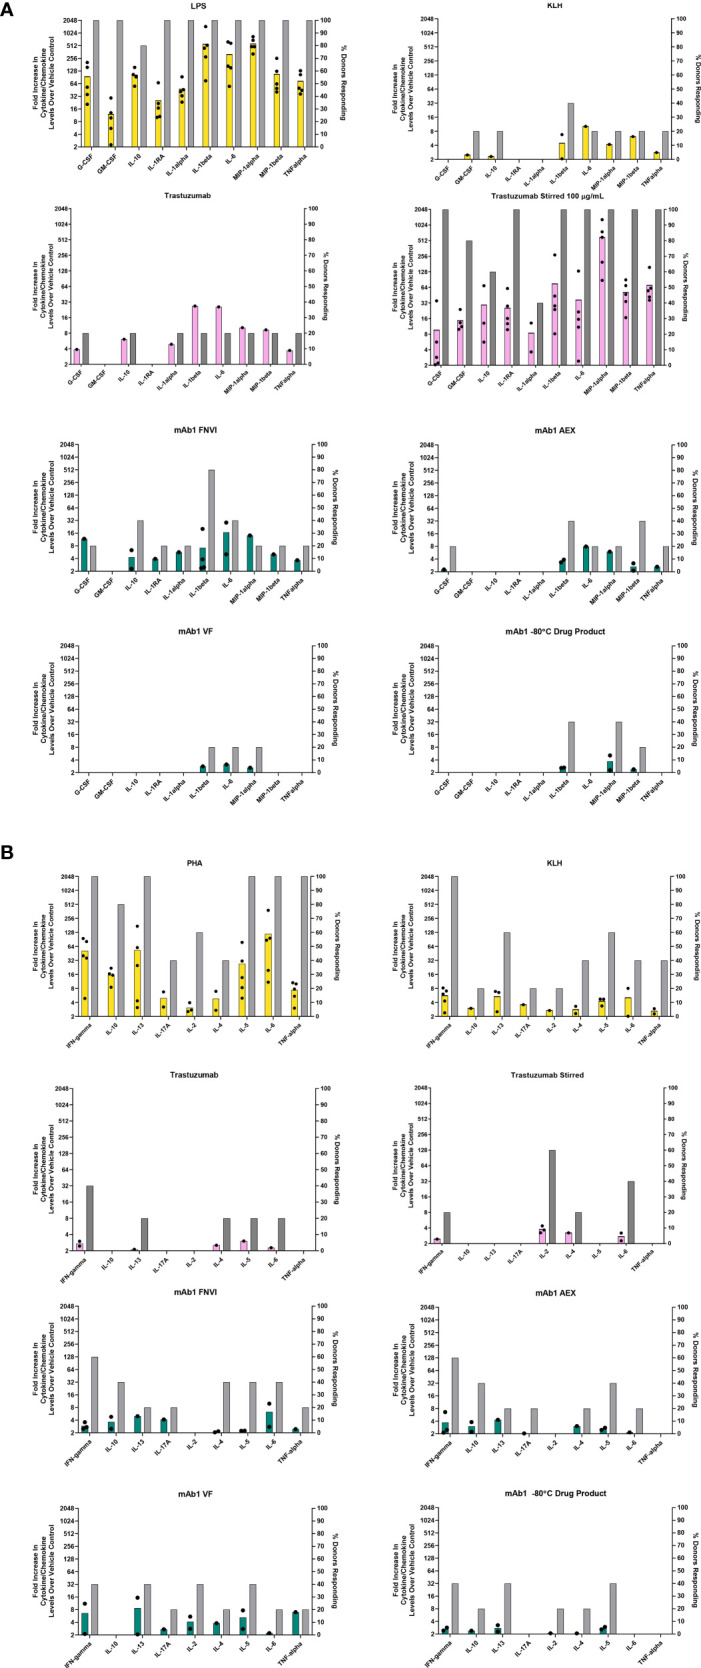
Figure 1.

In vitro PBMC responses to spontaneously occurring antibody aggregates obtained from process intermediates. Colored bar graphs correspond to the left Y-axis and represent the mean of positive donor responses (fold increase ≥ 2 is considered positive). Black dots show the individual donors that had a positive response. The grey bars correspond to the right Y-axis and represent the proportion of donors with positive responses to a particular analyte. (A) Innate immune responses measured at 20 hrs. (B) Adaptive immune responses measured on day 7. Data are from 5 donors.
