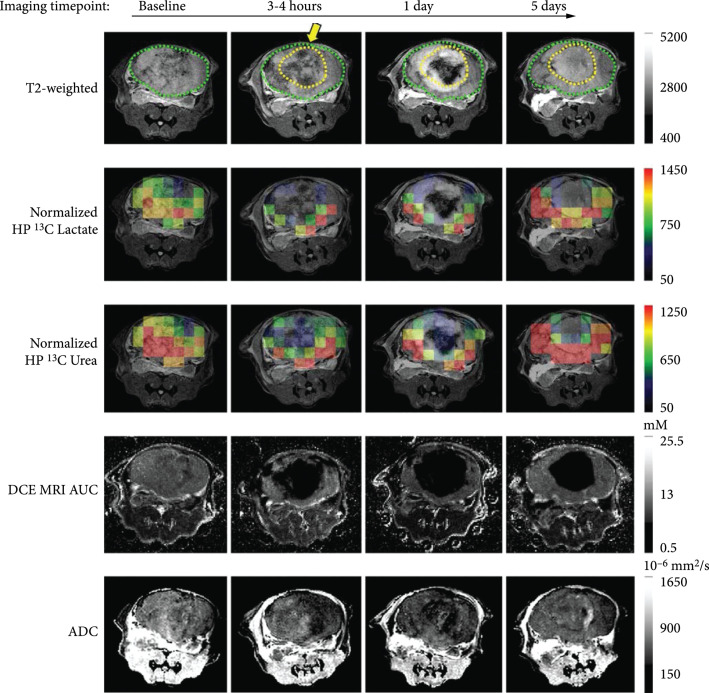
Figure 5.
Multiparametric and heteronuclear MRI imaging pre and postthermal HIFU in a preclinical mouse model. T2-weighted images pre- and post-HIFU thermal ablation treatment, overlaid HP 13C lactate and 13C urea images on the T2-weighted images, DCE MRI AUC, and ADC. The position of the HIFU applicator is indicated by the yellow arrow. The region of ablation is demarcated by a dashed yellow line. Figure adapted from [13].

