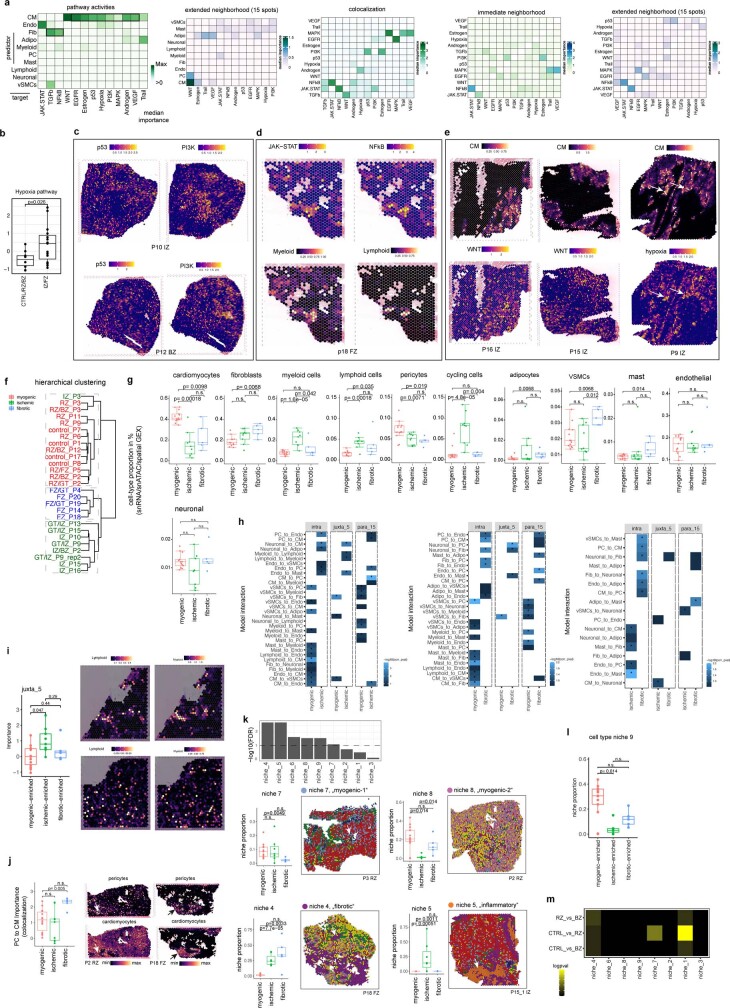
Extended Data Fig. 4. Spatial pathway and cell type dependency analysis.
a, Median standardized importances (> 0) of cell-type abundances within the spot and in the extended neighbourhood (effective radius = 15), and PROGENy pathway activities within a spot, and in the immediate or extended neighbourhood on the prediction of pathway activities inferred from spatially contextualized models. b, Standardized importances of cardiomyocyte abundances in the extended neighbourhood (radius of 15 spots) in predicting hypoxia pathway activity. Comparison was performed between two sample groups: control, border and remote zones samples (n = 10), and fibrotic and ischaemic samples (n = 15). Two-sided Wilcoxon rank sum test. c–e, Visualization examples of pathway to pathway and pathway to cell-type dependencies in spatial transcriptomics. (c) p53 and PI3K spatial pathway distribution. (d) JAK-STAT and NFkB activities’ dependencies to myeloid and lymphoid cells’ abundance. (e) Cardiomyocyte to WNT and hypoxia pathway dependency. f, Hierarchical clustering of the pseudo-bulk transcriptional profile of spatial transcriptomics slides of patient samples. Colour represents the three major sample groups. g, Comparisons of patient mean major cell-type proportions (inferred from snRNA, snATAC-seq data, and spatial transcriptomics) between myogenic, ischaemic and fibrotic groups. Two-sided Wilcoxon rank sum test. Each dot represents a patient sample (n=13 for myogenic group, n=9 for ischaemic group, n=5 for fibrotic group). h, Pairwise comparison between patient groups of the standardized importances of cell-type abundances within the same spot (intra), and in the immediate (juxta) or extended neighborhood (para) to predict other cell types’ abundances (two-sided Wilcoxon rank sum test). Myogenic vs ischaemic (left), myogenic vs fibrotic (middle), fibrotic vs ischaemic (right). * = adj. P-value <= 0.15. i, Comparison of standardized importances of lymphoid cells’ abundances in the immediate neighborhood (juxta) to predict myeloid cells between myogenic, ischaemic, and fibrotic groups (two-sided Wilcoxon rank sum test). Visualization of lymphoid and myeloid cells in an ischaemic (up) and control (down) sample. j, Comparison of standardized importances of pericytes’ abundances to predict cardiomyocytes’ abundances within the same spot (two-sided Wilcoxon rank sum test). Each dot represents a sample (n = 14 for myogenic group, n=9 for ischaemic group, n = 5 for fibrotic group). Spatial distributions of pericyte and cardiomyocytes abundances estimated from deconvolution in a myogenic sample (left) and a fibrotic sample (right). Arrows in the fibrotic enriched sample show a strong colocalization event. k, Comparison of the compositions of cell-type niches between myogenic, fibrotic, and ischaemic groups (Kruskal-Wallis test, line denotes an adj. P-value < 0.1). Comparison of the proportions of cell-type niches 4, 5, 7, and 8 between groups (adj. P-value estimated from two-sided Wilcoxon rank sum test) and visualization example. Each dot represents a patient sample (n for myogenic group = 13, n for ischaemic group = 7, n for fibrotic group = 5). l, Comparison of the proportions of cell-type niche 9 between groups (two-sided Wilcoxon rank sum test). Each dot represents a patient sample (n for myogenic group = 13, n for ischaemic group = 7, n for fibrotic group = 5). m, Pairwise comparison of the compositions of the cell-type niches between control, border and remote zone samples (two-sided Wilcoxon rank sum test). * = reflect changes with adj. P-value < 0.1, n for CTRL = 4, n for RZ = 5, n for BZ = 3. In b, g, i, j, k, l data are represented as boxplots where the middle line is the median, the lower and upper hinges correspond to the first and third quartiles, the upper whisker extends from the hinge to the largest value no further than 1.5 × IQR from the hinge (where IQR is the inter-quartile range) and the lower whisker extends from the hinge to the smallest value at most 1.5 × IQR of the hinge, while data beyond the end of the whiskers are outlying points that are plotted individually.

