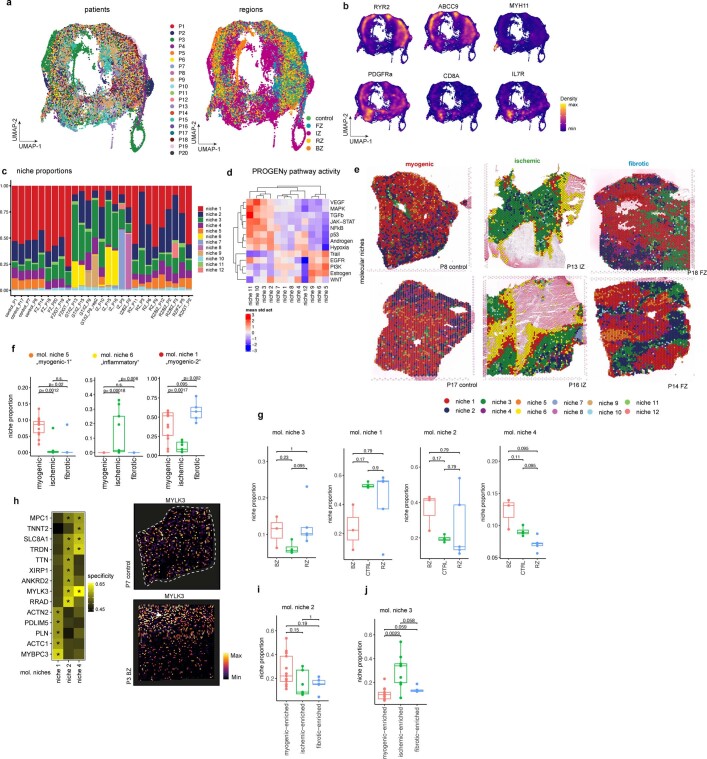
Extended Data Fig. 5. Characterization of molecular niches.
a, UMAP embedding of ST spots based on gene expression coloured by patients (left) and regions (right). b, Gene expression of RYR2, ABCC9, MYH11, PDGFRa, CD8A and IL7R. Colours refer to gene-weighted kernel density as estimated by using R package Nebulosa. c, Bar plots visualizing molecular niches proportion per patient. d, Standardized mean PROGENy pathway activities across different molecular niches. e, Visualization of molecular niches in control, IZ, and FZ samples. f, Comparison between patient groups of the proportions of molecular niches 5, 6, and 1 (adj. P-value from a two-sided Wilcoxon rank sum test). Each dot represents a patient sample (n for myogenic group = 13, n for ischaemic group = 9, n for fibrotic group = 5). g, Comparison between control (CTRL), border zone (BZ) and remote zone (RZ) of the proportions of molecular niches 1, 2, 3, and 4 (adj. P-value, two-sided Wilcoxon rank sum test, Box-Whisker plots showing median and IQR. Maximum and minimum values as described previously). Each dot represents a patient sample (n for BZ = 3, n for CTRL = 4, n for RZ group = 4). h, Top five differentially upregulated genes between spots belonging to molecular niches enriched with cardiomyocytes. Summary area under the curve (AUC) is used as a size effect of comparing the expression of one molecular niche against the rest. * = reflect FDR < 0.05 and summary AUC > 0.55 (n for mol. niche 0 = 30,058, n for mol. niche 1 = 19,958, n for mol. niche 3 = 7,360). Spatial distribution of the expression of MYLK3 in a control slide (upper) and a border zone (lower) i, Comparison between patient groups of the proportions of molecular niche 2 (adj. P-value, two-sided Wilcoxon rank sum test, Box-Whisker plots showing median and IQR. Maximum and minimum values as described previously). Each dot represents a patient sample (n for myogenic group = 13, n for ischaemic group = 9, n for fibrotic group = 5). j, Same as (i) for niche 3. In f, g, i, j data are represented as boxplots where the middle line is the median, the lower and upper hinges correspond to the first and third quartiles, the upper whisker extends from the hinge to the largest value no further than 1.5 × IQR from the hinge (where IQR is the inter-quartile range) and the lower whisker extends from the hinge to the smallest value at most 1.5 × IQR of the hinge, while data beyond the end of the whiskers are outlying points that are plotted individually.

