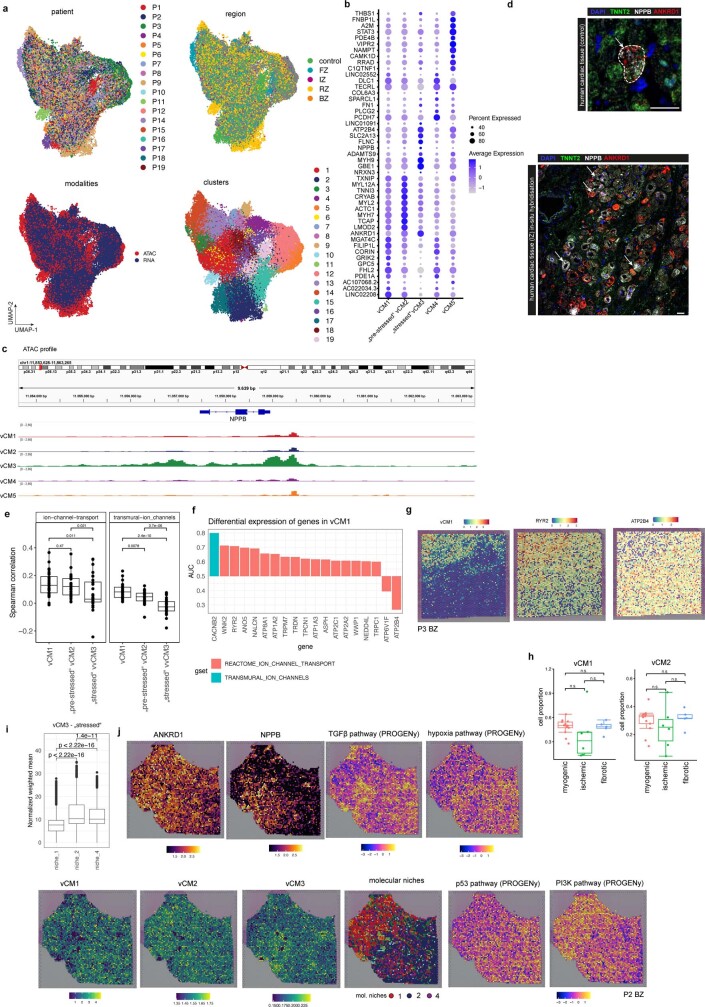
Extended Data Fig. 6. Characterization of cardiomyocyte state clusters.
a, UMAP embedding of the integrated snRNA-seq and snATAC-seq data coloured by patients, regions, modalities, and clusters (resolution= 1). b, Dot plot showing the top 10 upregulated genes for each CM-state. c, State-specific pseudo bulk ATAC-seq profiles showing distinct chromatin accessibility for NPPB between different states. d, In situ RNA hybridization of NPPB, ANKRD1 and TNNT2 on human cardiac control tissue (upper panel). Note that only a single NPPB/ANKRD1 positive cardiomyocyte could be detected. (below) Representative image of the same in-situ staining of a human myocardial infarction sample. Note the NPPB and ANKRD1 expression in several cardiomyocytes (arrows). Scale bars: 25 µm (upper) + 50 µm (lower). e, Spearman correlation between the spatial expression of Ion-channel transport and transmural-ion channels related genes to the expression of the marker genes (state scores) of vCM1-3 (two-sided Wilcoxon rank sum test). Each dot represents a visium slide (n = 28). f, Differential gene expression of ion channel related genes in vCM1 contrasted to vCM3 cardiomyocytes (two-sided Wilcoxon rank sum test, area under the curve (AUC) is shown as size effect). Colours refer to the gene set membership of each gene. g, Visualization of vCM1 gene marker expression mapping (state scores) and the expression of RYR2 and ATP2B4 in a border zone sample. h, Comparison of vCM1 and vCM2 cell proportion between patient groups. P-values were calculated using Wilcoxon Rank Sum test (unpaired, two-sided). Each dot represents a sample (n = 13 for myogenic group, n = 7 for ischaemic group, and n = 4 for fibrotic group). i, Distribution of vCM3 marker gene expression (state-score) across molecular niche 1, 2, and 4. Each dot represents a spatial transcriptomics spot belonging to a molecular niche across samples (n = 30,058 for niche 1, n = 19,958 for niche 2, niche 4 = 7,360). Two-sided Wilcoxon rank sum test, adj. p-values (niche 1 vs niche 4 = 0, niche 2 vs niche 4 = 2e-09, niche 1 vs niche 2 = 0). j, Visualisation of the expression of ANKRD1 and NPPB, the spatial distribution of TGFβ, hypoxia, p53 and PI3K signaling activities, the spatial distribution of the expression of vCM-states marker genes (state score) for a border zone sample and the distribution of molecular niches 1,2, and 4. Box-Whisker plots showing median and IQR. Maximum and minimum values as described previously. In e, h, i data are represented as boxplots where the middle line is the median, the lower and upper hinges correspond to the first and third quartiles, the upper whisker extends from the hinge to the largest value no further than 1.5 × IQR from the hinge (where IQR is the inter-quartile range) and the lower whisker extends from the hinge to the smallest value at most 1.5 × IQR of the hinge, while data beyond the end of the whiskers are outlying points that are plotted individually. In a-c the number of spots of the bottom panels correspond to the barplots in the upper panel.

