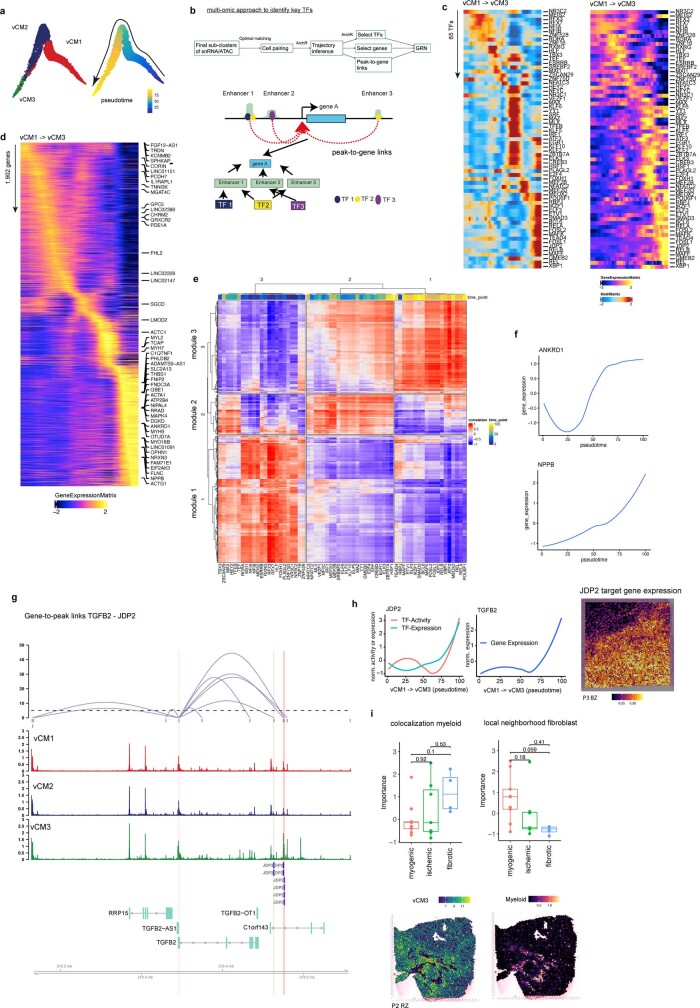
Extended Data Fig. 7. Cardiomyocyte pseudotime and gene-regulatory network analysis.
a, Diffusion map embedding of pseudotime cardiomyocyte clusters vCM1, vCM2 and vCM3. b, Computational workflow for building gene regulatory network (upper) and schematic of linking TF to target genes through peak-to-gene links and predicted TF binding sites (lower). c, Heatmap showing TF binding activity and gene expression along the pseudotime trajectory. d, Heatmap of gene expression across pseudotime vCM1-vCM3. e, Heatmap showing the correlation between TF binding activity and gene expression along the pseudotime trajectory from vCM1 to vCM3. Colors on the top refer to pseudotime point where the TF showed the highest binding activity. Clustering analysis identified three modules. f, ANKRD1 and NPPB CM-stress marker gene expression along pseudotime vCM1-vCM3. g, Peak-to-gene links showing that JDP2 regulates TGFB2. Each loop represents a putative link between TGFB2 and a peak. Loop height represents the significance of the correlation and dash line represents threshold of significance (P = 0.05). ATAC-seq tracks were generated from pseudo-bulk chromatin profiles of vCM1, vCM2, and vCM3. Binding sites of JDP2 are highlighted. h, Line plots showing TF activity and expression after z-score normalization (y-axis) over pseudotime (x-axis) for JDP2 (left), its corresponding target gene expression after z-score normalization (y-axis) over pseudotime (x-axis) for TGFB2 (middle), and visualization of all target genes in the BZ sample (right). i, Comparison of standardized importances of myeloid abundances within the spot and fibroblast abundances in the local neighbourhood (radius of 5 spots) to predict vCM3 between patient groups samples. Each dot represents a sample (n = 9 for myogenic group, n = 7 for ischaemic group, n = 4 for fibrotic group). (lower panel) Spatial distribution of the state score of vCM3 and myeloid cell abundances in a RZ slide with histological evidence of a scar. (Two-sided Wilcoxon rank sum test, Box-Whisker plots showing median and IQR. Maximum and minimum values as described previously.) Data are represented as boxplots where the middle line is the median, the lower and upper hinges correspond to the first and third quartiles, the upper whisker extends from the hinge to the largest value no further than 1.5 × IQR from the hinge (where IQR is the inter-quartile range) and the lower whisker extends from the hinge to the smallest value at most 1.5 × IQR of the hinge, while data beyond the end of the whiskers are outlying points that are plotted individually. In a-c the number of spots of the bottom panels correspond to the barplots in the upper panel.

