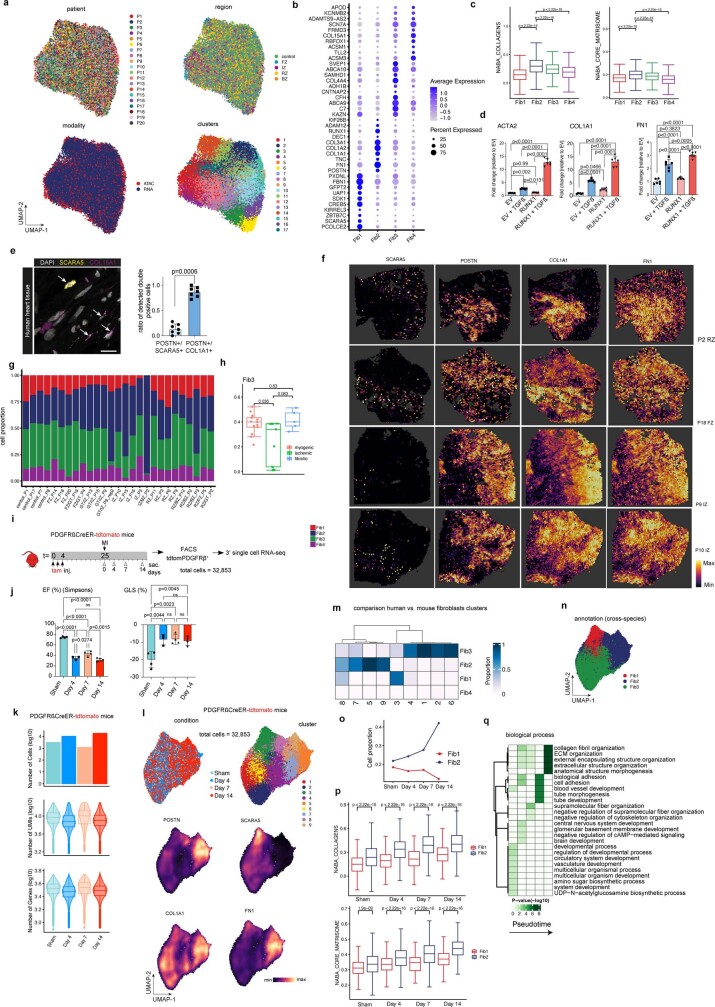
Extended Data Fig. 9. Fibroblast heterogeneity and PDGFRb lineage tracing in murine MI.
a. UMAP embedding of integrated snRNA-seq and snATAC-seq data coloured by patients, regions, modalities and clusters (resolution = 0.9). b, Marker dot plot showing the DEGs for each fibroblast state. c, Box plots showing module score of NABA-collagen and NABA-core-matrisome score per fibroblast state. P-values were calculated using Wilcoxon rank sum (unpaired and two sided). d, Expression of COL1A1, ACTA2 and FN1 by RNA qPCR after RUNX1 overexpression with and without TGFβ compared to empty vector (EV) (n = 6). One-way ANOVA followed by Bonferroni correction. Error bars = S.D. e, In situ hybridization (RNAscope) on human myocardial tissue of SCARA5 and COL15a1 and quantification and comparison of SCARA5+/POSTN+ cells vs. POSTN+/COL1A1+ cells in human heart failure tissues (n = 7). Mann-Whitney test. Error bars = S.D. f, Visualization of SCARA5, POSTN, COL1A1 and FN1 on spatial transcriptomics slides from IZ and FZ human MI samples. g, Cell-type state compositions across patient sample. h, Comparison of Fib3 cell proportion between patient groups. P-values were calculated using Wilcoxon Rank Sum test (unpaired, two-sided). Each dot represents a sample (n = 13 for myogenic group, n = 7 for ischaemic group, and n = 4 for fibrotic group). i, Time course of lineage tracing experiment using PDGFRβCreER-tdTomato mice. j, Results of echocardiographic measurements EF (in %), and global longitudinal strain (GLS, in %), for each of the time points. One-way-ANOVA. n=4 day 0, n=3 day 4, n=4 day 7, n=4 day 14. Error bars = S.D. k, Quality measurements of single-cell RNA-Seq data from mouse MI experiment. l, UMAP representation of time points, cluster and gene expression (POSTN, SCARA5, COL1A1 and FN1) from mouse MI experiment. m, Confusion matrix comparing predicted fibroblasts states and obtained clusters for mouse dataset. n, UMAP representation of species cross-annotation of fibroblast clusters. o, Cell proportion of mouse fibroblast state Fib1 (SCARA5+) and Fib2 (POSTN+) per MI time-point. p, Box plots showing NABA collagens scores and NABA core matrisome score per fibroblast state (mouse Fib1 vs. Fib1) per time point. P-values were calculated using Wilcoxon rank sum (unpaired and two sided) (Sham: n = 578 for Fib1 and n = 685 for Fib2; Day 4: n = 1688 for Fib1 and n = 2498 for Fib2; Day 7: n = 203 for Fib1 and n = 330 for Fib2; Day 14: n = 2232 for Fib1 and n = 7684 for Fib2). q, Gene set enrichment analysis per human fibroblast-cell state. Scale bar: 10 µm. In c, d, h, k, p data are represented as boxplots where the middle line is the median, the lower and upper hinges correspond to the first and third quartiles, the upper whisker extends from the hinge to the largest value no further than 1.5 × IQR from the hinge (where IQR is the inter-quartile range) and the lower whisker extends from the hinge to the smallest value at most 1.5 × IQR of the hinge, while data beyond the end of the whiskers are outlying points that are plotted individually.

