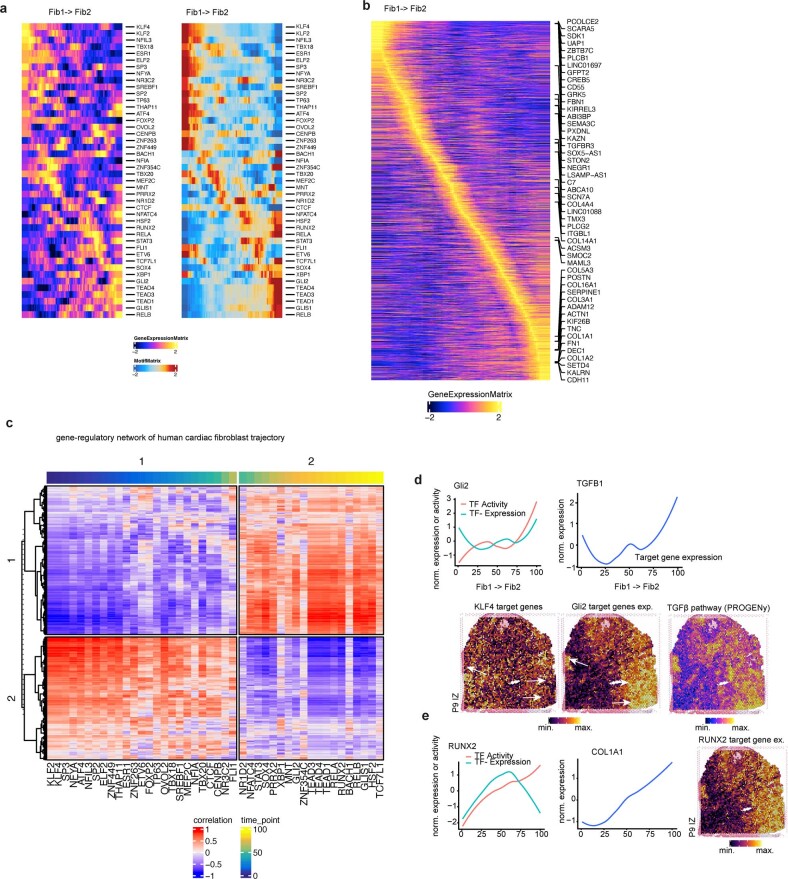
Extended Data Fig. 10. Gene regulatory network analysis of human cardiac fibroblasts.
a, Pseudotime heatmap showing gene expression (left) and TF binding activity (right) along the trajectory Fib1 to Fib2 (myofibroblasts). b, Pseudotime heatmap showing highly variable genes along the trajectory. c, Heatmap showing the correlation between TF binding activity and gene expression each TF from (a) and gene from (b). Each column represents a TF and each row represents a TF. Colours on the top refer to pseudotime labels for each TF estimated based on binding activity. d, Upper: line plots showing TF activity and expression after z-score normalization (y-axis) over pseudotime (x-axis) for GLI2 and their corresponding target gene expression after z-score normalization (y-axis) over pseudotime (x-axis) for TGFB1. Lower: visualization of target gene expression of KLF4 and GLI2, and TGFB pathway activity in the BZ sample. e, Line plots showing TF activity and expression after z-score normalization (y-axis) over pseudotime (x-axis) for RUNX2 and its corresponding target gene expression after z-score normalization (y-axis) over pseudotime (x-axis) for COL1A1. Visualization of RUNX2 target genes in the BZ sample (right).

