
Fig. 3. Characteristic tissue structures inferred from spatial transcriptomics data.
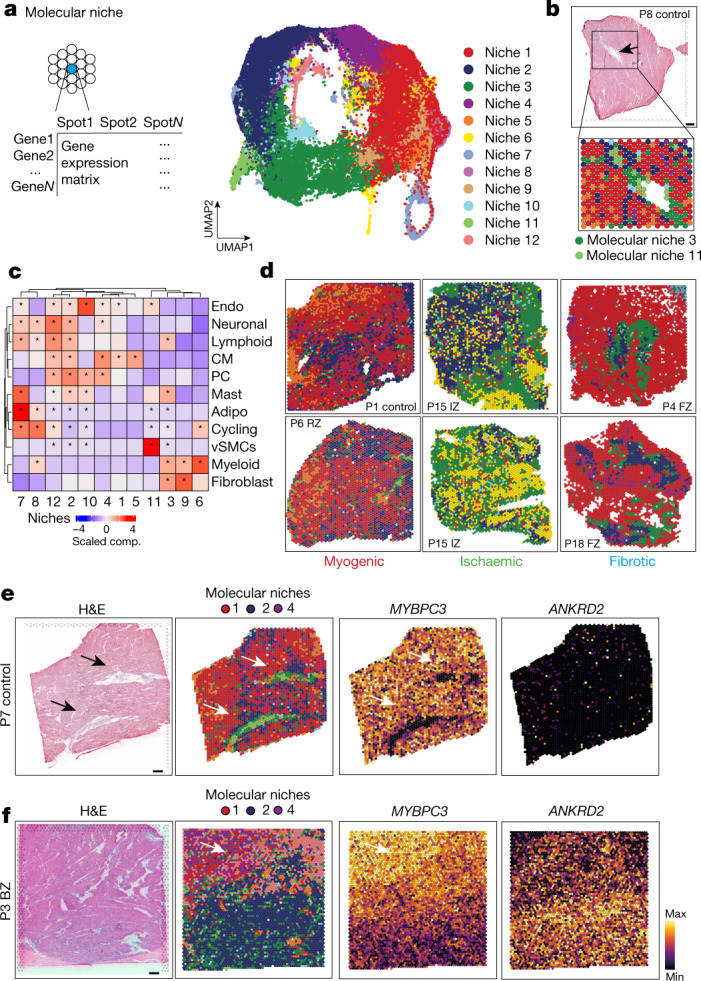
a, Schematic of molecular niche definition and UMAP of spatial transcriptomics spots based on gene expression. b, Spatial mapping of molecular niches. Arrows highlight molecular niche 11 (enriched in MYH11+ vSMCs) surrounded by molecular niche 3 (enriched in PDGFRA+ fibroblasts). c, Scaled median cell-type compositions within each molecular niche. Asterisks indicate increased composition of a cell type in a niche compared with other niches (one-sided Wilcoxon rank-sum test, adj. P < 0.05). d, Distribution of molecular niches in three different patient groups. Note the differential abundance of molecular niches 1 (red) and 6 (yellow). e,f, Haematoxylin and eosin (H&E) staining and visualization of molecular niches 1, 2 and 4 and gene expression (MYBPC3 and ANKRD2) of a control (e) and a border zone (f). Scale bars, 10 mm. For details on visualization, statistics and reproducibility, see Methods.