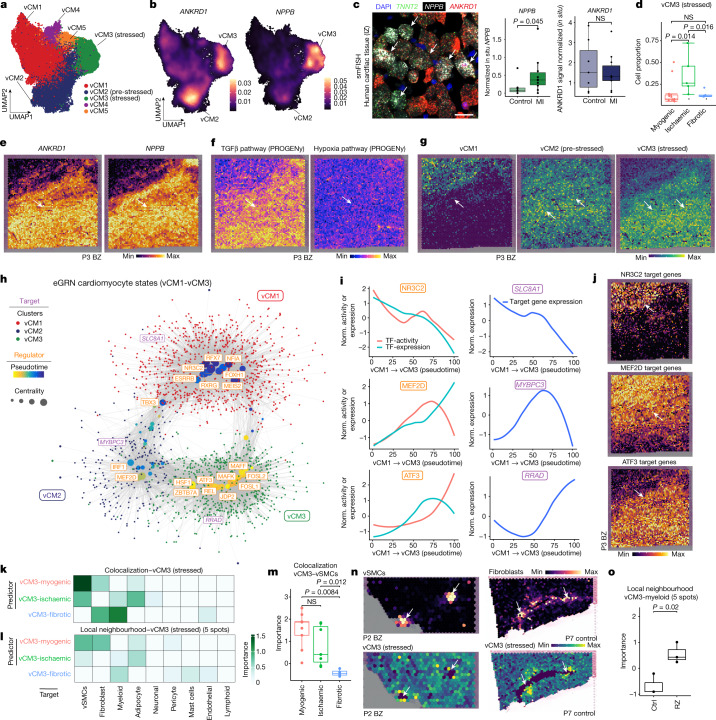
Fig. 4. Sub-clustering of cardiomyocytes.
a, Sub-clustering of cardiomyocytes. b, Gene expression of ANKRD1 and NPPB. c, Left, smFISH staining of vCM3 marker genes. Scale bar, 50 µm. Right, quantification of NPPB and ANKRD1 signal relative to the TNNT2 signal. Two-sided Wilcoxon rank-sum test (control donors: n = 7, patients with myocardial infarction (MI): n = 10). d, Proportion of stressed vCM3 cells. Wilcoxon rank-sum test (unpaired, two-sided; myogenic: n = 13 myogenic, ischaemic: n = 7, fibrotic: n = 4). e–g, Expression of ANKRD1 and NPPB (e), TGFβ and hypoxia signalling activities (f) and expression of vCM-state marker genes (g) in a border zone sample. h, eGRN analysis including vCM1, vCM2 and vCM3. Each node represents a transcription factor (regulator) or a gene (target). i, Transcription factor activity and expression over pseudotime. Norm., normalized. j, Expression of transcription factor target genes in the border zone sample, as in e. k,l, Mean importance of the abundance of major cell types within a spot (k) and the local neighbourhood (within a 5-spot radius) (l) in the prediction of vCM3 in spatial transcriptomics. m, Importance of vSMC abundance predict vCM3 in myogenic, ischaemic and fibrotic groups within a spot (adj. P-value, two-sided Wilcoxon rank-sum test; myogenic: n = 9, ischaemic: n = 7, fibrotic: n = 4). n, Deconvoluted abundance of vSMCs or fibroblasts and vCM3 state scores in a border zone (left) and a control human heart (right). o, Importance of myeloid cell abundance in the local neighbourhood for predicting vCM3 in control and remote zone samples (two-sided t-test; controls: n = 3, remote zones: n = 3). For details on visualization, statistics and reproducibility, see Methods.

