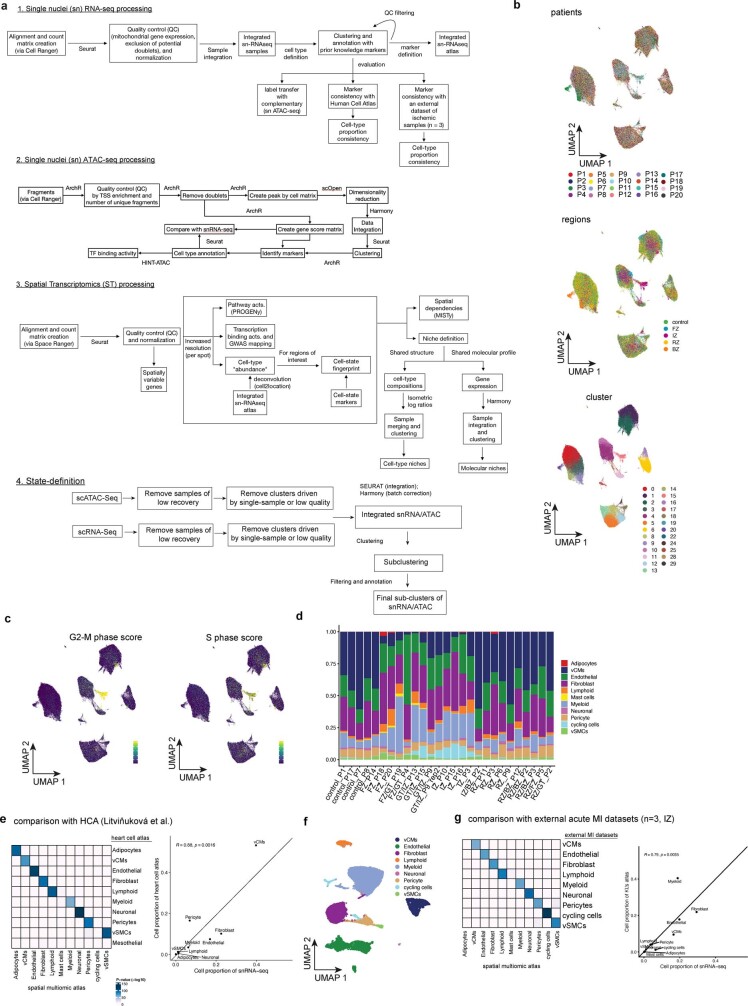
Extended Data Fig. 1. Computational workflow and snRNA-Seq data analysis.
a, Schematic of the computational workflow for the main analyses of snRNA-seq, snATAC-seq, and spatial transcriptomics data. b, UMAP embedding of snRNA-seq data from all samples for patients, regions, and clusters. c, UMAP embedding of snRNA-seq data showing G2-M-phase cell-cycle score (left) and S-phase score (right). d, Barplots showing cell-type proportions of snRNA-seq data across all samples. Colours indicate different major cell types. e, Comparison of the generated snRNA-seq atlas to a previously published human heart cell atlas (HCA) for molecular profiles (left) and cell-type proportion (right). Left panel shows the adjusted P-value of the overlap of top gene markers of each cell-type between the different data sets (hypergeometric test). Right panel shows the Pearson correlation between the median proportion of each shared cell-type of the reference atlas and our control, border zone, and remote zone samples. f, UMAP embedding and annotation of an external dataset of three ischaemic zone samples following MI. g, Comparison of the generated snRNA-seq atlas to the external ischaemic data for molecular profiles (left) and cell-type proportion (right). Left panel shows the adjusted P-value of the overlap of top gene markers of each cell-type between the different data sets (hypergeometric test). Right panel shows the Pearson correlation between the median proportion of each shared cell-type of the external data set and our ischaemic samples.

