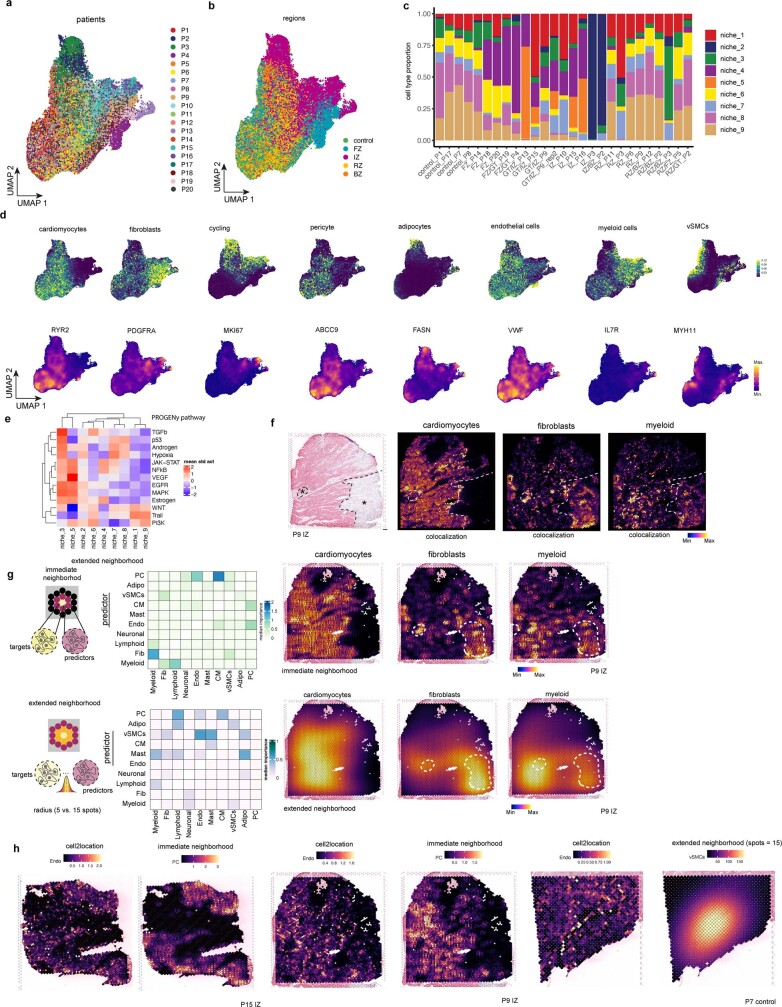
Extended Data Fig. 3. Cell-type niches and spatially contextualized views analysis.
a-b, UMAP embedding of spatial transcriptomics (ST) spots based on major cell-type compositions coloured by the patient (a) or region (b). c, Cell-type niche compositions across patient sample. d, UMAP embedding of ST spots based on major cell-type compositions colored by the compositions of cycling cells, pericytes, adipocytes, endothelial cells and myeloid cells and their respective marker genes (RYR2 cardiomyocytes, PDGFRA fibroblasts, MKI67 cycling cells, ABCC9 pericytes, FASN adipocytes, VWF endothelial cells, IL7R myeloid cells, and MYH11 vSMCs). e, Standardized mean PROGENy pathway activities across different niches. f, H&E staining and cell2location cell-type abundance estimations of cardiomyocytes, fibroblasts and myeloid cells. Delineated areas represent myogenic or fibroblast/myeloid cell enriched tissue areas. g, Median standardized importances (> 0) of cell-type abundances in the prediction of other cell types within the immediate neighbourhood (upper part) and the extended neighbourhood (effective radius of 15 spots) (lower part) inferred from spatially contextualized models. Cell-type abundances of the immediate (upper panels) and extended neighbourhood of cardiomyocytes, fibroblasts and myeloid cells. h, Visualization examples of the dependencies between the abundance of endothelial cells and the abundance of pericytes in the immediate neighborhood, and vascular smooth muscle cells in the extended neighbourhood (effective radius of 15 spots) visualized on three tissues.

