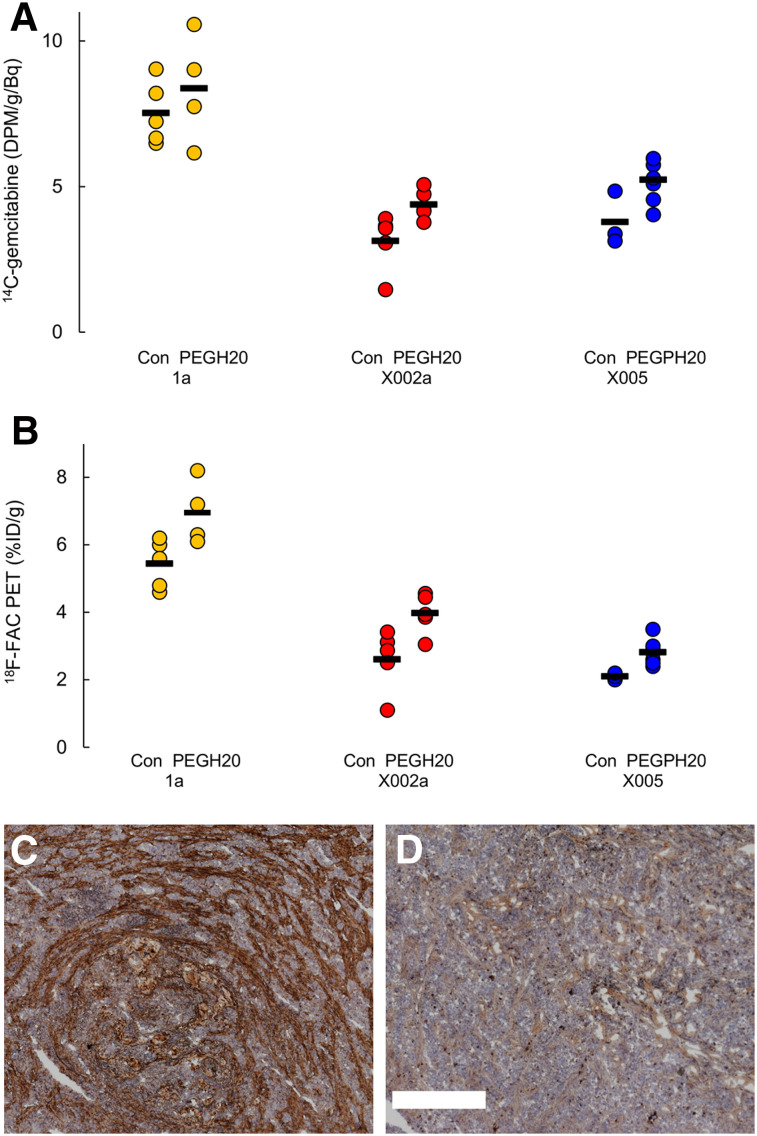
FIGURE 2.
(A and B) Effect of PEGPH20 on 14C-gemcitabine, measured ex vivo (A), and 18F-FAC, quantified by PET (B). Mean value for each group is indicated by black line. Significance (P < 0.05) between control and PEGPH20 was observed for all cases except 14C-gemcitabine in PDX 1a. Data are from same experiment as in Figure 1. (C and D) Hyaluronidase staining (brown) in representative sections of control PDX 1a tumor (C) and PEGPH20-treated tumor (D). Scale bar = 500 μm.

