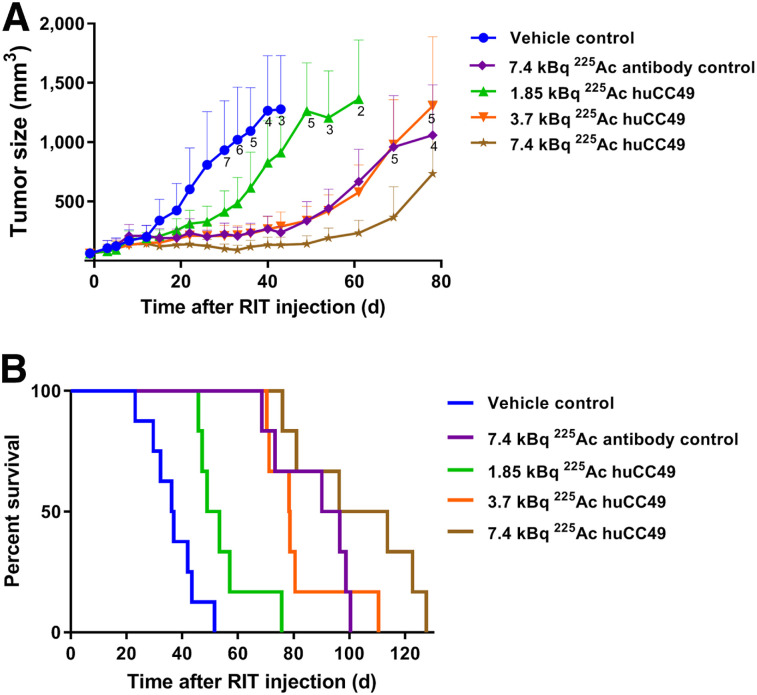
FIGURE 2.
Dose escalation of 225Ac-DOTAylated-huCC49 mice bearing OVCAR3 xenografts. (A) Tumor volume vs. time after radioimmunotherapy (RIT). (B) Kaplan–Meier survival plot (n = 8 for control group; n = 6 for all other groups). Tumor growth curves for 7.4-kBq untargeted (P = 0.0001), 3.7-kBq targeted (P = 0.0001), and 7.4-kBq targeted (P < 0.0001) groups were statistically significant compared with untreated controls. Survival curves for 7.4-kBq untargeted (P = 0.0011), 1.85-kBq targeted (P = 0.0054), 3.7-kBq targeted (P = 0.0003), and 7.4-kBq targeted (P = 0.0003) groups were statistically significant compared with controls.

