. 2022 Aug 2:M22-0803. doi: 10.7326/M22-0803

Figure 2. Average weekly deaths per 100 000 population for the 54 most populous U.S. counties, 30 May 2021 through 4 June 2022.

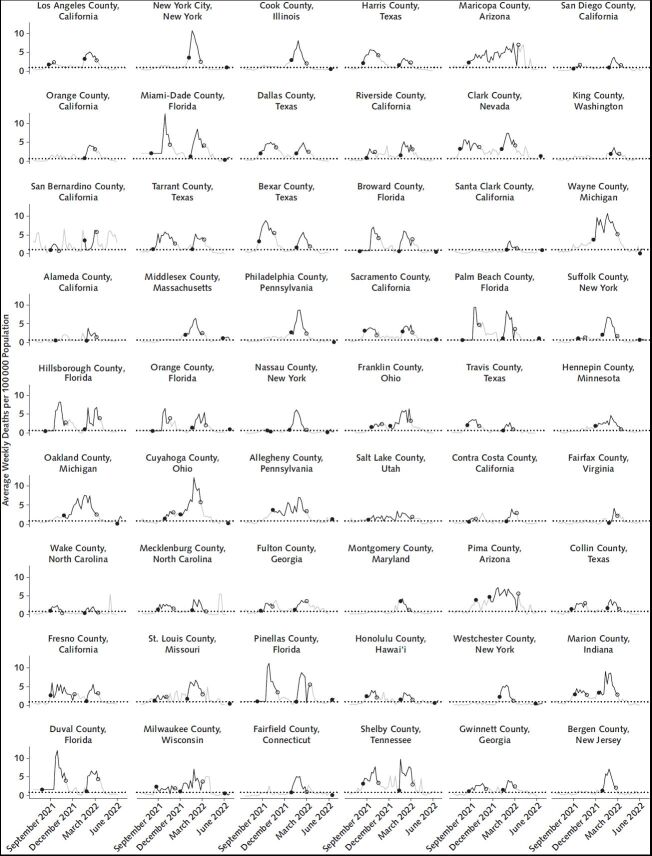
Figure 2. Average weekly deaths per 100 000 population for the 54 most populous U.S. counties, 30 May 2021 through 4 June 2022. Segments marked in black show average death rates seen 3 weeks after a county meets CDC criteria for high COVID-19 community level, whereas gray segments show 3-week lagged death rates after periods meeting criteria for low or medium COVID-19 community level. The dotted horizontal line marks a reference level of 0.9 deaths per 100 000 population per week (7). Solid circles mark the lagged mortality after the first week of a distinct episode of high community levels, whereas open circles mark the final week of a high episode. The choice of a 3-week lag for pairing observed mortality to weeks of high COVID-19 community levels follows the design of the CDC metrics based on predictive accuracy for mortality and other severe outcomes at a 3-week lag and is consistent with an approximate duration of 3 weeks between diagnosis and death.

Segments marked in black show average death rates seen 3 weeks after a county meets CDC criteria for high COVID-19 community level, whereas gray segments show 3-week lagged death rates after periods meeting criteria for low or medium COVID-19 community level. The dotted horizontal line marks a reference level of 0.9 deaths per 100 000 population per week (7). Solid circles mark the lagged mortality after the first week of a distinct episode of high community levels, whereas open circles mark the final week of a high episode. The choice of a 3-week lag for pairing observed mortality to weeks of high COVID-19 community levels follows the design of the CDC metrics based on predictive accuracy for mortality and other severe outcomes at a 3-week lag and is consistent with an approximate duration of 3 weeks between diagnosis and death.